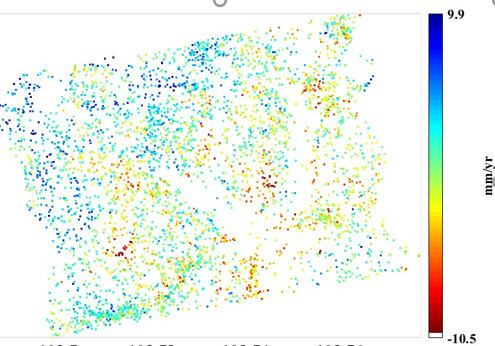
Hello, I have done PSI analysis to measure surface deformation for about 2 years using 31 Sentinal-1 images by SNAP-SNAPHU software. I have obtained 9.9 mm/yr mean deformation rate when I use all 31 images in one interval for 2 years as shown in fig-1, but I got 371.7 mm/yr mean deformation rate when I divide 2 years period into 5 equal intervals as shown in fig-2, how to remove this error? which one is correct one?, kindly guide, Thanks.

Please be more explicit how you process the SAR data. This will narrow the possible answers.
I have done PSI analysis for a time period of Jan-2014 to Jan-2015. When I take mean deformation using single interval from Jan-2014 to Jan-2015, I got -9 to +10 mm/yr velocity, but when I divide it in five intervals from (11 Jan 2015 to 18 May 2015, -371 to +378 mm/yr), (11 Jun 2015 to 26 Nov 2015, -768 to +962 mm/yr), (20 December 2015 to 12 May 2016, -454 to 558 mm/yr), (5 June 2016 to 20 November 2016 ), (14 December 2016 to 31 January 2017 -648 to +923 mm/yr), I got very larger velocity for all these intervals, why this so large difference between these values?
Sorry, did you mention the SAR instrument?
IMH the SAR data from S-1 are from Nov 2014 onwards.
I used SNAP software for PSI analysis and Sentinel-1 data is from Jan-2014 to July 2017.