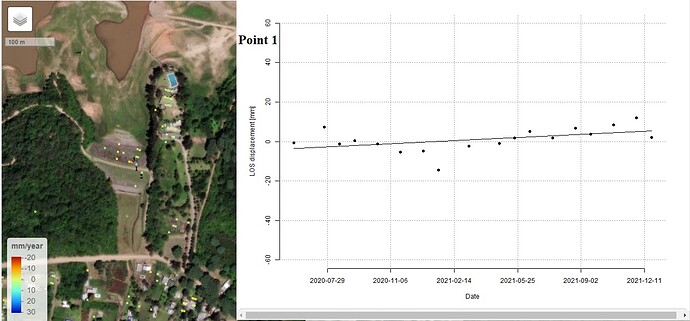
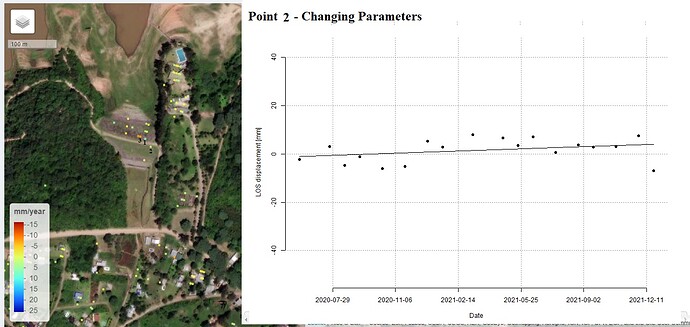
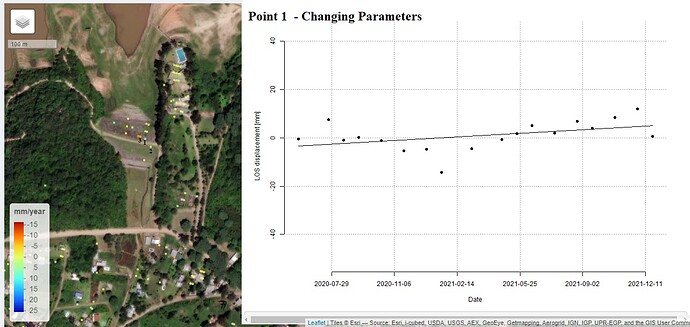
Hello dear colleagues! I have followed many of your posts to do the following work and I would like to ask for your help in this regard. I have carried out PSI to monitor a small dam of loose materials that is known, by microgeodesy controls, it have settlements (Figure 1) at the right and left ends of the crest of the order of 18 mm/y according to the latest controls.

Figure 1
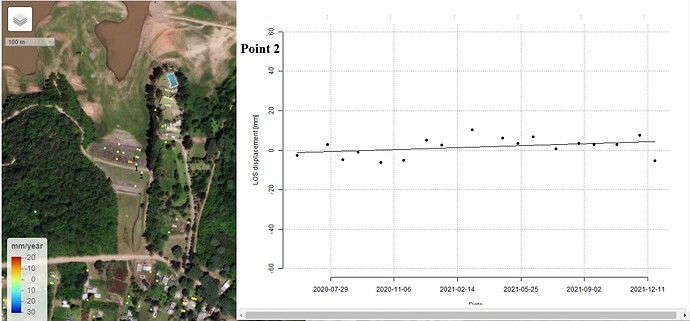
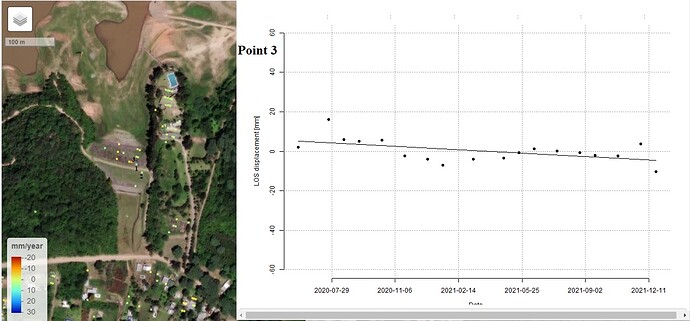
My first difficulty was finding only a few PS in the area, however some of the ones I found don’t behave as I expected. I ran many tests but I would like to discuss these with 3 PS close to the zone of interest:
Test 1.
• Trial period: July 2020 - December 2021
• Number of Interferograms: 18
Points 1 and 2 closest to the settlement zone are uplifted instead of having a subsidence trend. The closest to the behavior is 3.
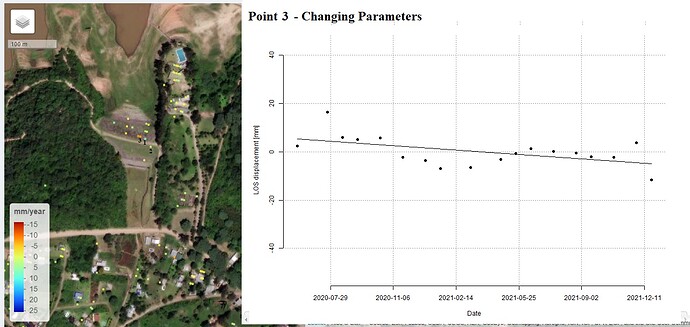
Test 2.
• Trial period: July 2020 - December 2021
• Number of Interferograms: 18
Changing some parameters related to the DEM and adding topographic phase removal, an additional orange point appears with the expected trend; however, points 1 and 2 continue to appear with anomalous behavior.
Could you guide me on what to take into account to analyze this data or reasons why my results could be so inaccurate there? Any comment or suggestion would help me a lot. Greetings. Thank you very much in advance to all of you.
1 Like
you did not mention what tools you use to generate the results, many processing details are not known. But first, try to use more dataset, like 30 dataset.
My workflow until the export to StaMPS was:
- TOPSAR-Split and Orbit-File:
Orbit State Vectors: SENTINEL-1 Precise (Auto-download)
Polynomial Degree: Grade 3
- Back-Geocoding.
Digital Elevation Model: SRTM 1Sc HGT (Auto Download)
DEM Resampling Method: BILINEAR_INTERPOLATION.
Resampling Type: BILINEAR_INTERPOLATION
Mask out areas with no elevation: Selected
Output Deramp and Demod Phase: Not selected.
Disable Reramp: Not selected.
- S-1 TOP- Deburst
- Interferogram formation
Subtract Flat-Earth phase: Selected
Degree of “Flat Earth” polynomial: 5
Number of “Flat Earth” estimation points: 501
Orbit interpolation degree: 3
Subtract topographic phase
Digital Elevation Model: SRTM 1Sc HGT (Auto Download)
Tile Extension [%]: 100
Output Elevation: Selected
Output Orthorectified Lat/Lon: Selected
Include coherence estimation: Selected
Square Pixel: Coherence range 10. Azimuth window sizes 2.
- PSI/StaMPS Export
That was in the first test, then in the interferogram formation of the second time I lowered the Degree of “Flat Earth” polynomial to 3
and I also reduced the Number of “Flat Earth” estimation points (right now I don’t remember the number but I did reduce it). Also at this stage I separately added the Topographic Phase removal and just then exported to PSI/StaMPS.
My dataset is actually 55 images all coregistered with one, then each set of images has its own master giving me about 17 interferograms per set (I read in Hooper’s work from PSI on the Alcedo Volcano that this could be done). If I increase the number of images I actually end up losing PS.

