Is it the one from the package snap2stamps ?
Oh I just saw the link.
From the monitoring tool, I can see that snap is using more than 30 Go of RAM and from 60 to 80% of the processor while processing …
Despite the use of the consequent ressources, it takes a long time (>2 hours for a single pair) to compute this step while in my memory, it was between 5 and 10 minutes … As indicated in this post : Processing time for stamps export
On average v8 is faster. It is possible that there’s a bug that is currently slowing StaMPS export - @estebanaguilera@esteban.aguilera could you verify?
Hi @ABraun. Thank you very much for answering. I am using STAMPS 4.1 beta.
I have read the manual but can’t find the reference for SNAP.
I also do not have access to the “root” folder as its status is denied.
Is it necessary to work from that direction?
Instead I am using the Software / PSI_insar / INSAR_master_data * directory.
this is not related to SNAP, but you have to tell where the StaMPS scripts, snaphu and triangle are located so that these can be used in the processing. This is done by modifying and sourcing the StaMPS config file. It is briefly mentioned in the official manual, but explained at more detail here or here.
Once this is done, the mt_prep_snap command can be executed anywhere, but it makes sense to create a new (empty) directory for this, so you can keep track of the processing and delete it in case you want to restart again without deleting too much of other files.
The situation does not concern the stamps export, this is the coregistration, ifg creation, deburst ans the topophase removal step.
On a windows 10 computer, with 12 Go of RAM and 12 processor cores, it takes 7h30 for a single pair.
On a windows 10 computer, with 64 Go of RAM and 20 processor cores, it takes 6h for the same single pair …
I finally found the solution.
Thanks to the link provided by @ABraun, I solved the situation.
The problem came from the small cache size, about 1 Go by default.
By setting it to 22 Go, the calculation of part B of the processing chain snap2stamps was performed within 5 minutes.
However, that is strange for me that the maximum RAM was correctly set by default (11 Go for the 12 Go RAM computer and 44 Go for the 64 Go RAM computer) while the cache size is definitively too small by default …
Hello , thank you very much for your comments, I was studying this methodology in order to acquire a Matlab license. But for the moment it will not be possible. What tool could I substitute?
I am studying subsidence deformation.
I appreciate your comments
This is just to let know that we have been able to perform the whole processing chain from a computer with a Windows OS.
All the SNAP processing have been performed on Windows.
We have installed a Virtual Machine on Oracle to perform the StaMPS processing.
The first results seem coherent with the German monitoring (BodenBewegungsdienst Deutschland (BBD)), so now we can focus on the interpretation !
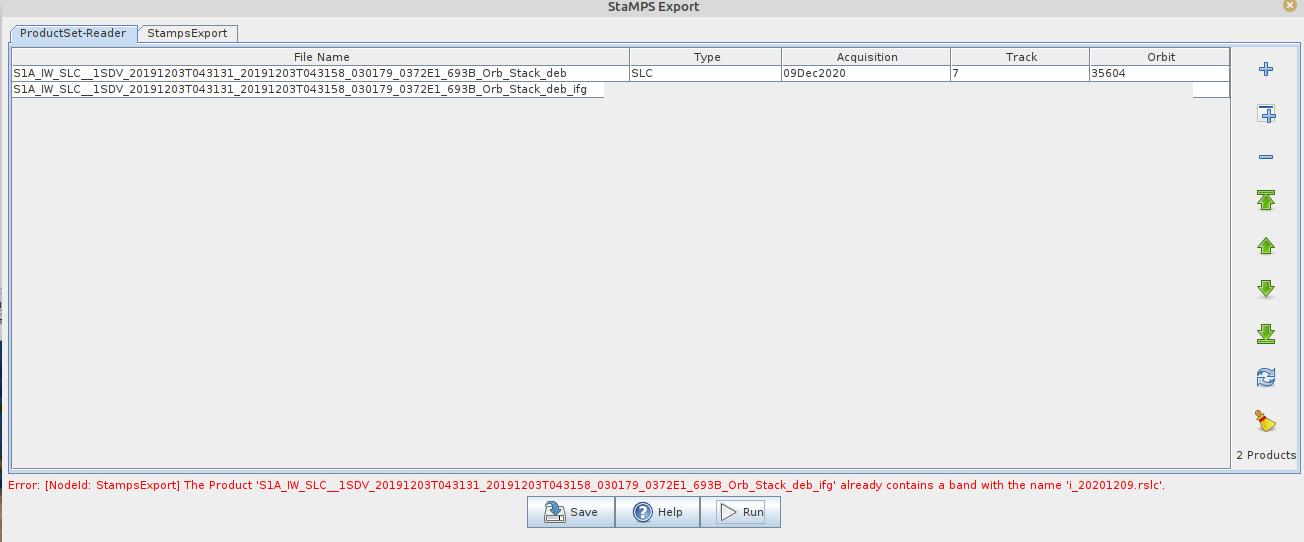
did you reduce the polarization to VV during TOPS split for all input products? This error can happen when you create a stack containing both VV and VH.
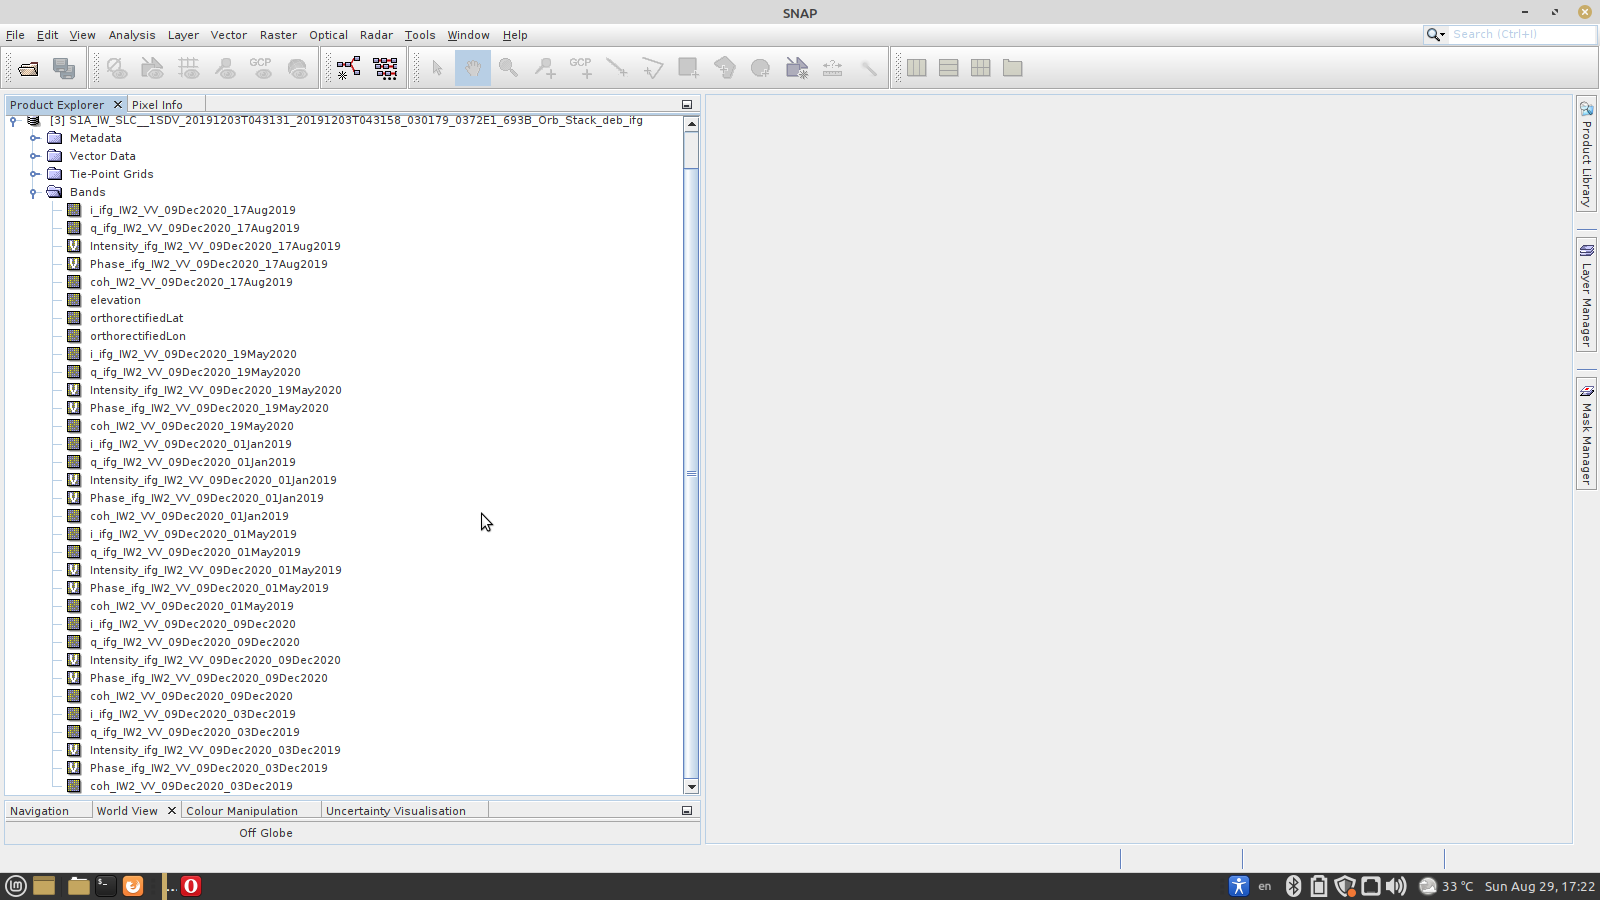
indeed there are two products in the interferogram stack which contain 09Dec2020 - I don’t know why this happened. How did you create the stack in general? I wonder why the lat lon and elevation bands were added after the first image pair and not at the end of the stack. Usually, you put all split products into the back geocoding operator at once.