Ok, I admit. I am a newbie.
it is my first time using python. I usually use Fortran or C++ and or Mathematica to do plotting and such.
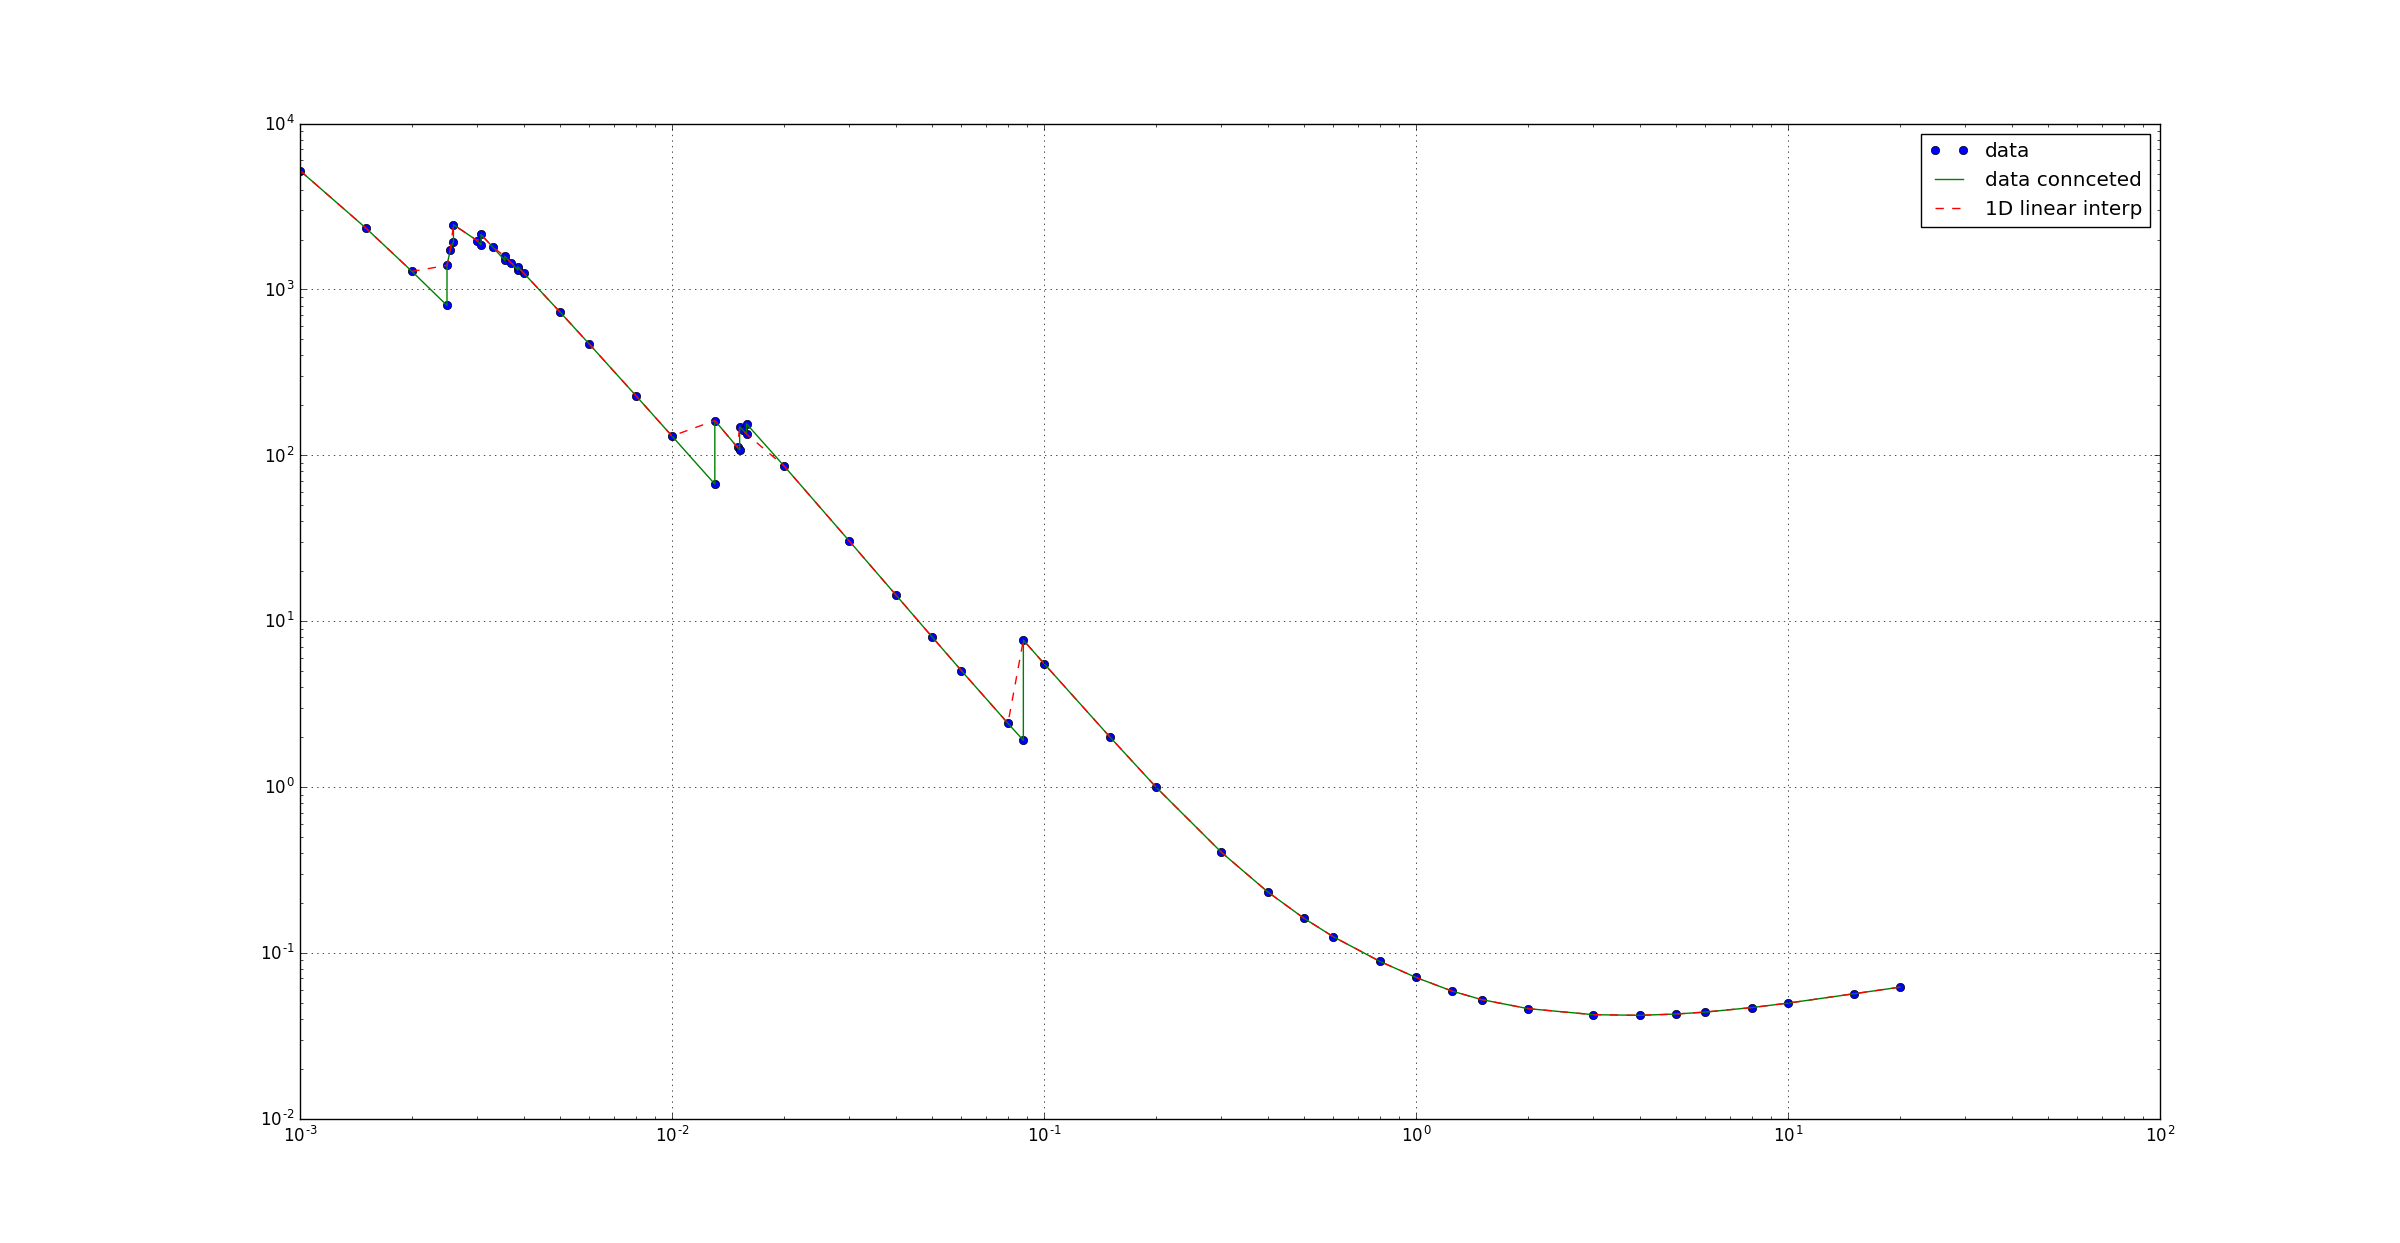
I wanted to interpolate a set of data, linearly. Just the simple method. But it does not work correctly, the interpolation ignores some of the data set.
Here is what the plot shows. Points are the data, green line is the connected data by matplotlib, while the red line is the interpolated data using scipy:
from scipy.interpolate import interp1d
import matplotlib.pyplot as plt
import numpy as np

x=[]
y=[]

fl= open("pb.dat","r")

for line in fl:
    line= line.split()
    x.append(float(line[0]))
    y.append(float(line[1]))

f= interp1d(x,y)

plt.plot(x,y,'o',x,y,'-',x,f(x),'--')
plt.legend(['data','data connceted','1D linear interp'],loc='best')
plt.semilogx()
plt.semilogy()
plt.grid(True)
plt.show()
One expects the green and the red to coincide, but they don’t!
Note: I tried first scipy.interpolate then I tried np.interp. Both gave me identical behavior.