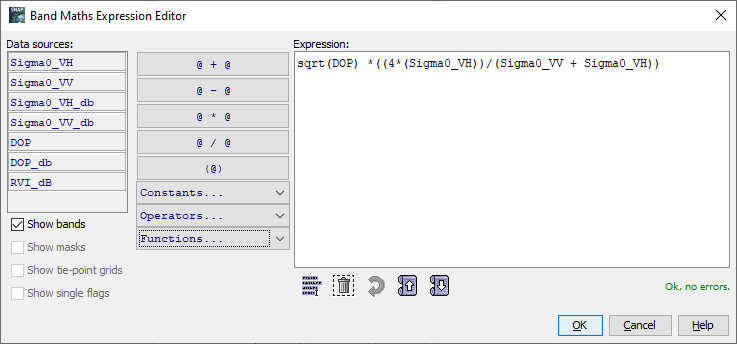
I am trying to calculate radar vegetation index with dual polarization data (VV-VH). So at first I am calculated DOP or Degree of polarization (VV/VV+VH), and after that value of DOP is multiply with RVI formula. Before multiplying DOP value, I am using square root of DOP. The formula is sqrt(dop)((4VH)/(VV+VH)). The RVI range should be 0 to 1.
But my final image highest value is 1.5 and lowest value is -439666.75. And my final image content are only agriculture area.
So my concern is, is it possible the lowest value come in minus and highest value >1? Also am I doing correct calculation of RVI?
are you using data in linear or log scale? This makes a difference for the formula. Also in the source to the script it is not specified if linear or log data was used.
Sorry for wrong information, after geometric correction I have done the “Linear to/from db” conversion and then I used “Convert Band”. Then I Export it in Geotiff/Bigtiff.
Please calculate the RVI in SNAP before exporting. Chances are high that the data was rescaled during the export process, leading to different input values for the calculation.
I am calculate the RVI in SNAP but how to check RVI range in SNAP?
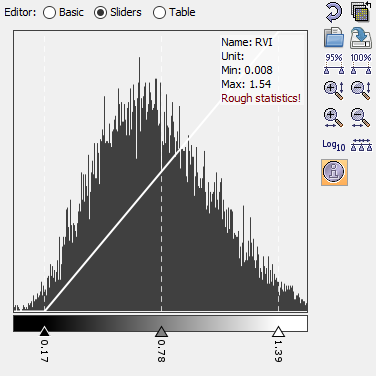
After calculating RVI with above described formula, I am exporting the RVI with Two Sigma0_db band and DOP. When image was open in arcgis then value range is showing 1.5 to -3651.56.
Don’t export to GeoTiff, simply open the img files inside the .data folder of the BEAM DIMAP product in ArcMap. Conversion of formats potentially rescales the data.
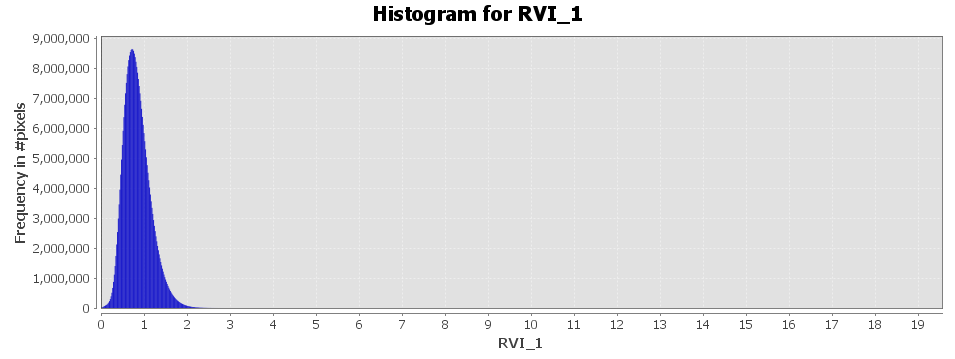
As your consulting, I am calculated the RVI without linear to db conversion. But RVI value range is come between 0 to 4 where its suppose to be 0 to 1.
So my consulting is why RVI value range is exceeds 1.
The thing is, the link you provided does not allow to check if this index really ranges between 0 and 1.
I would just see it as a relative measure, regardless of the scaling.
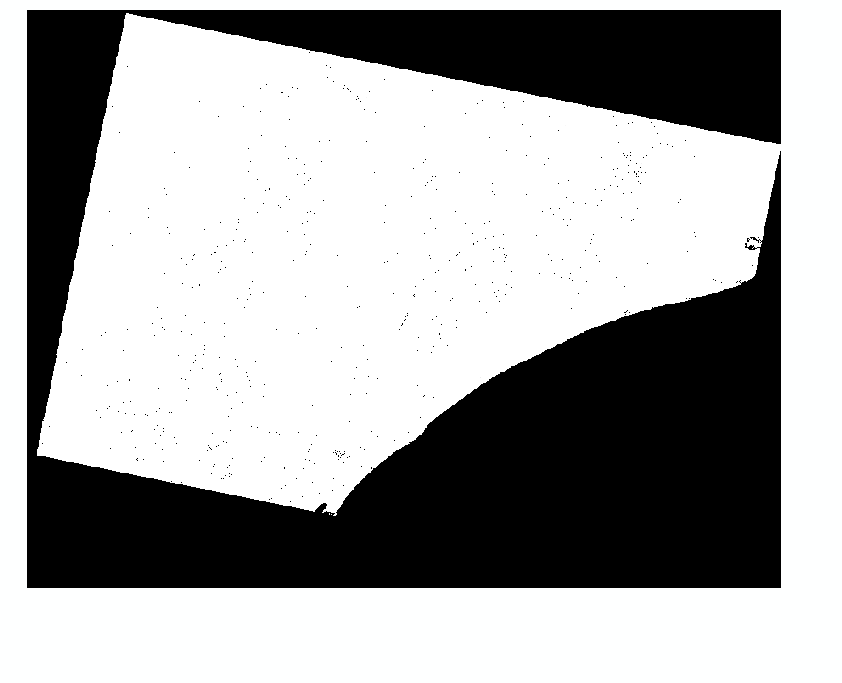
Can you tell me what are the pre-processing steps you followed before calculating RVI? Because this time I am calculating RVI in linear scale but this time I am getting Lowest value in minus and when I am open RVI.img file in arcgis its completely white like this
Radiometric calibration to Sigma0 and Terrain Correction.
You have to apply a correct color stretch in ArcGIS, the nodata value outside is not set correctly. Go to the symbology and stretch the colors between 0 and 2 to have better visual contrasts.