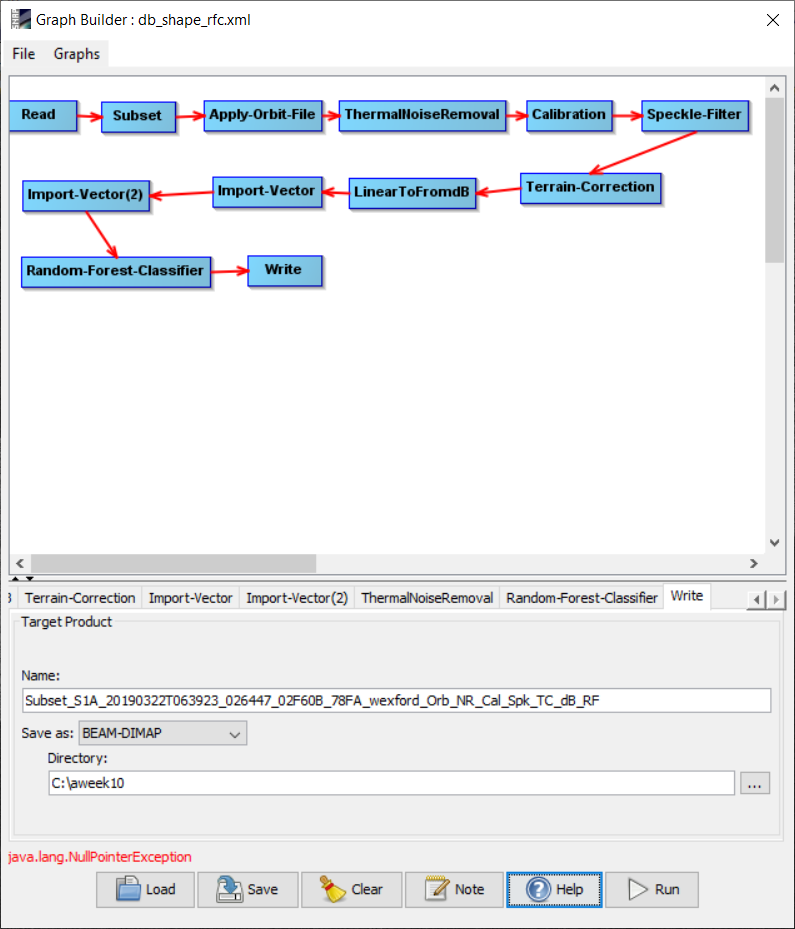
I was trying to do a Random Forest supervised Classification using two training samples (land and water) on Sentinel 1 GRD data and I am getting the following error message “java.lang.NullPointerException”
As I am new to SNAP program it would be great someone could help me understand the error message and drop a line regarding workflow for the graph is correct or not.
The workflow looks correct at first sight, although many things can happen in the different operators which could lead to errors. Some questions for clarification:
Why do you have Import Vector twice? In case one is for each class, it would be probably avoid errors to have both in one polygon and import it once. Did you check the RandomForest classification tab if both are recognized as inputs?
Are the coordinate reference systems of the raster and the vector the same? For the raster you select it during the Terrain Correction.
Why do you process this as a graph? I’m convinced that if you process these steps separately, you are faster and more likely to identify potential errors. Like this, you have little chance to find the source of the error because you cannot inspect the intermediate products. The messag itself is unfortunately not telling us.
Thanks a million for getting back to me on my query.
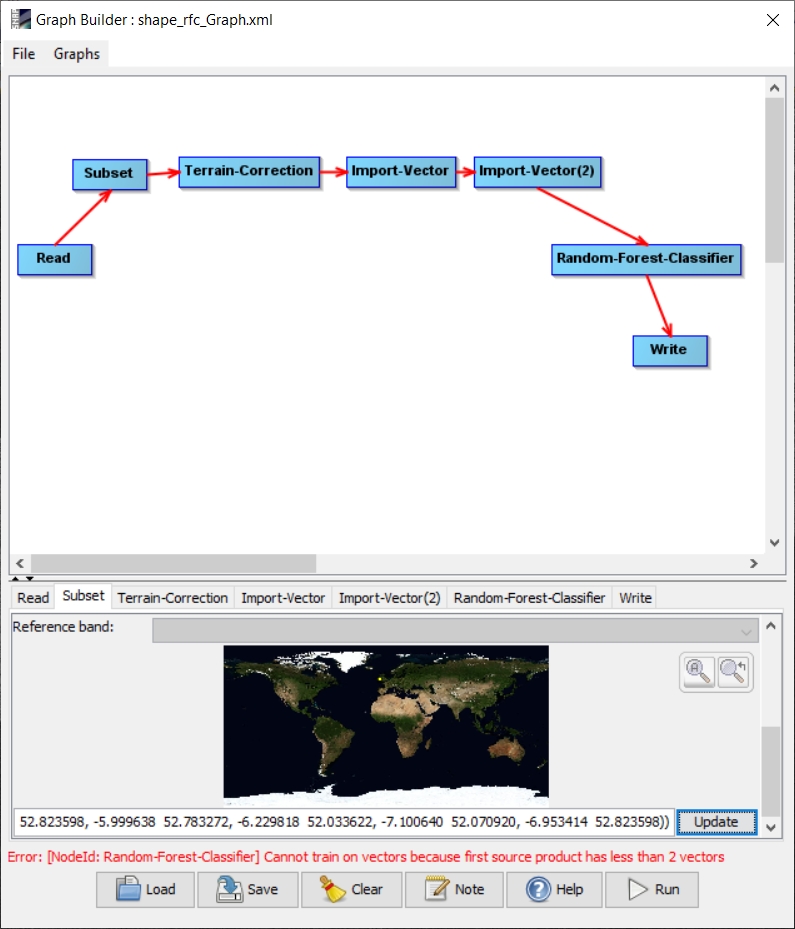
As you can see in the attached graph, I think the problem is with the Random forest classifier as it is looking for at least two training samples.
We are hoping to use it for a flood plain monitoring project if it works. Actually, we would like to estimate the spatial extent of land and water using available Sentinel 1 GRD dat. Therefore, if we could make the graph work, it would save a ton of our time as opposed to classifying each image separately. If we work on individual images using graphic user interface it works without any issues.
We have the training samples in the same projection (WGS84-geographic) as the terrain corrected imagery.
The reason why we try to input the training vectors (land and water) in two steps was that I do NOT know how to create two training sites as single shape file using SNAP.
In the attached graph, if we run the graph without random forest classification, it works perfectly.
Question: Is there a way I could insert the training samples (as shape files ) to the input file in the above work flow?
yes, I recommend using a shapefile containing both classes as a text attribute (for example as described here)
Planning to automate is reasonable, but for the creating of a prototype you should first make sure that each of the steps takes the output of the previous step as a valid input. I recommend to test this first before creatign graphs. Once this works from start to the end, you can gradually build larger graphs until you have correctly connected the entire workflow.
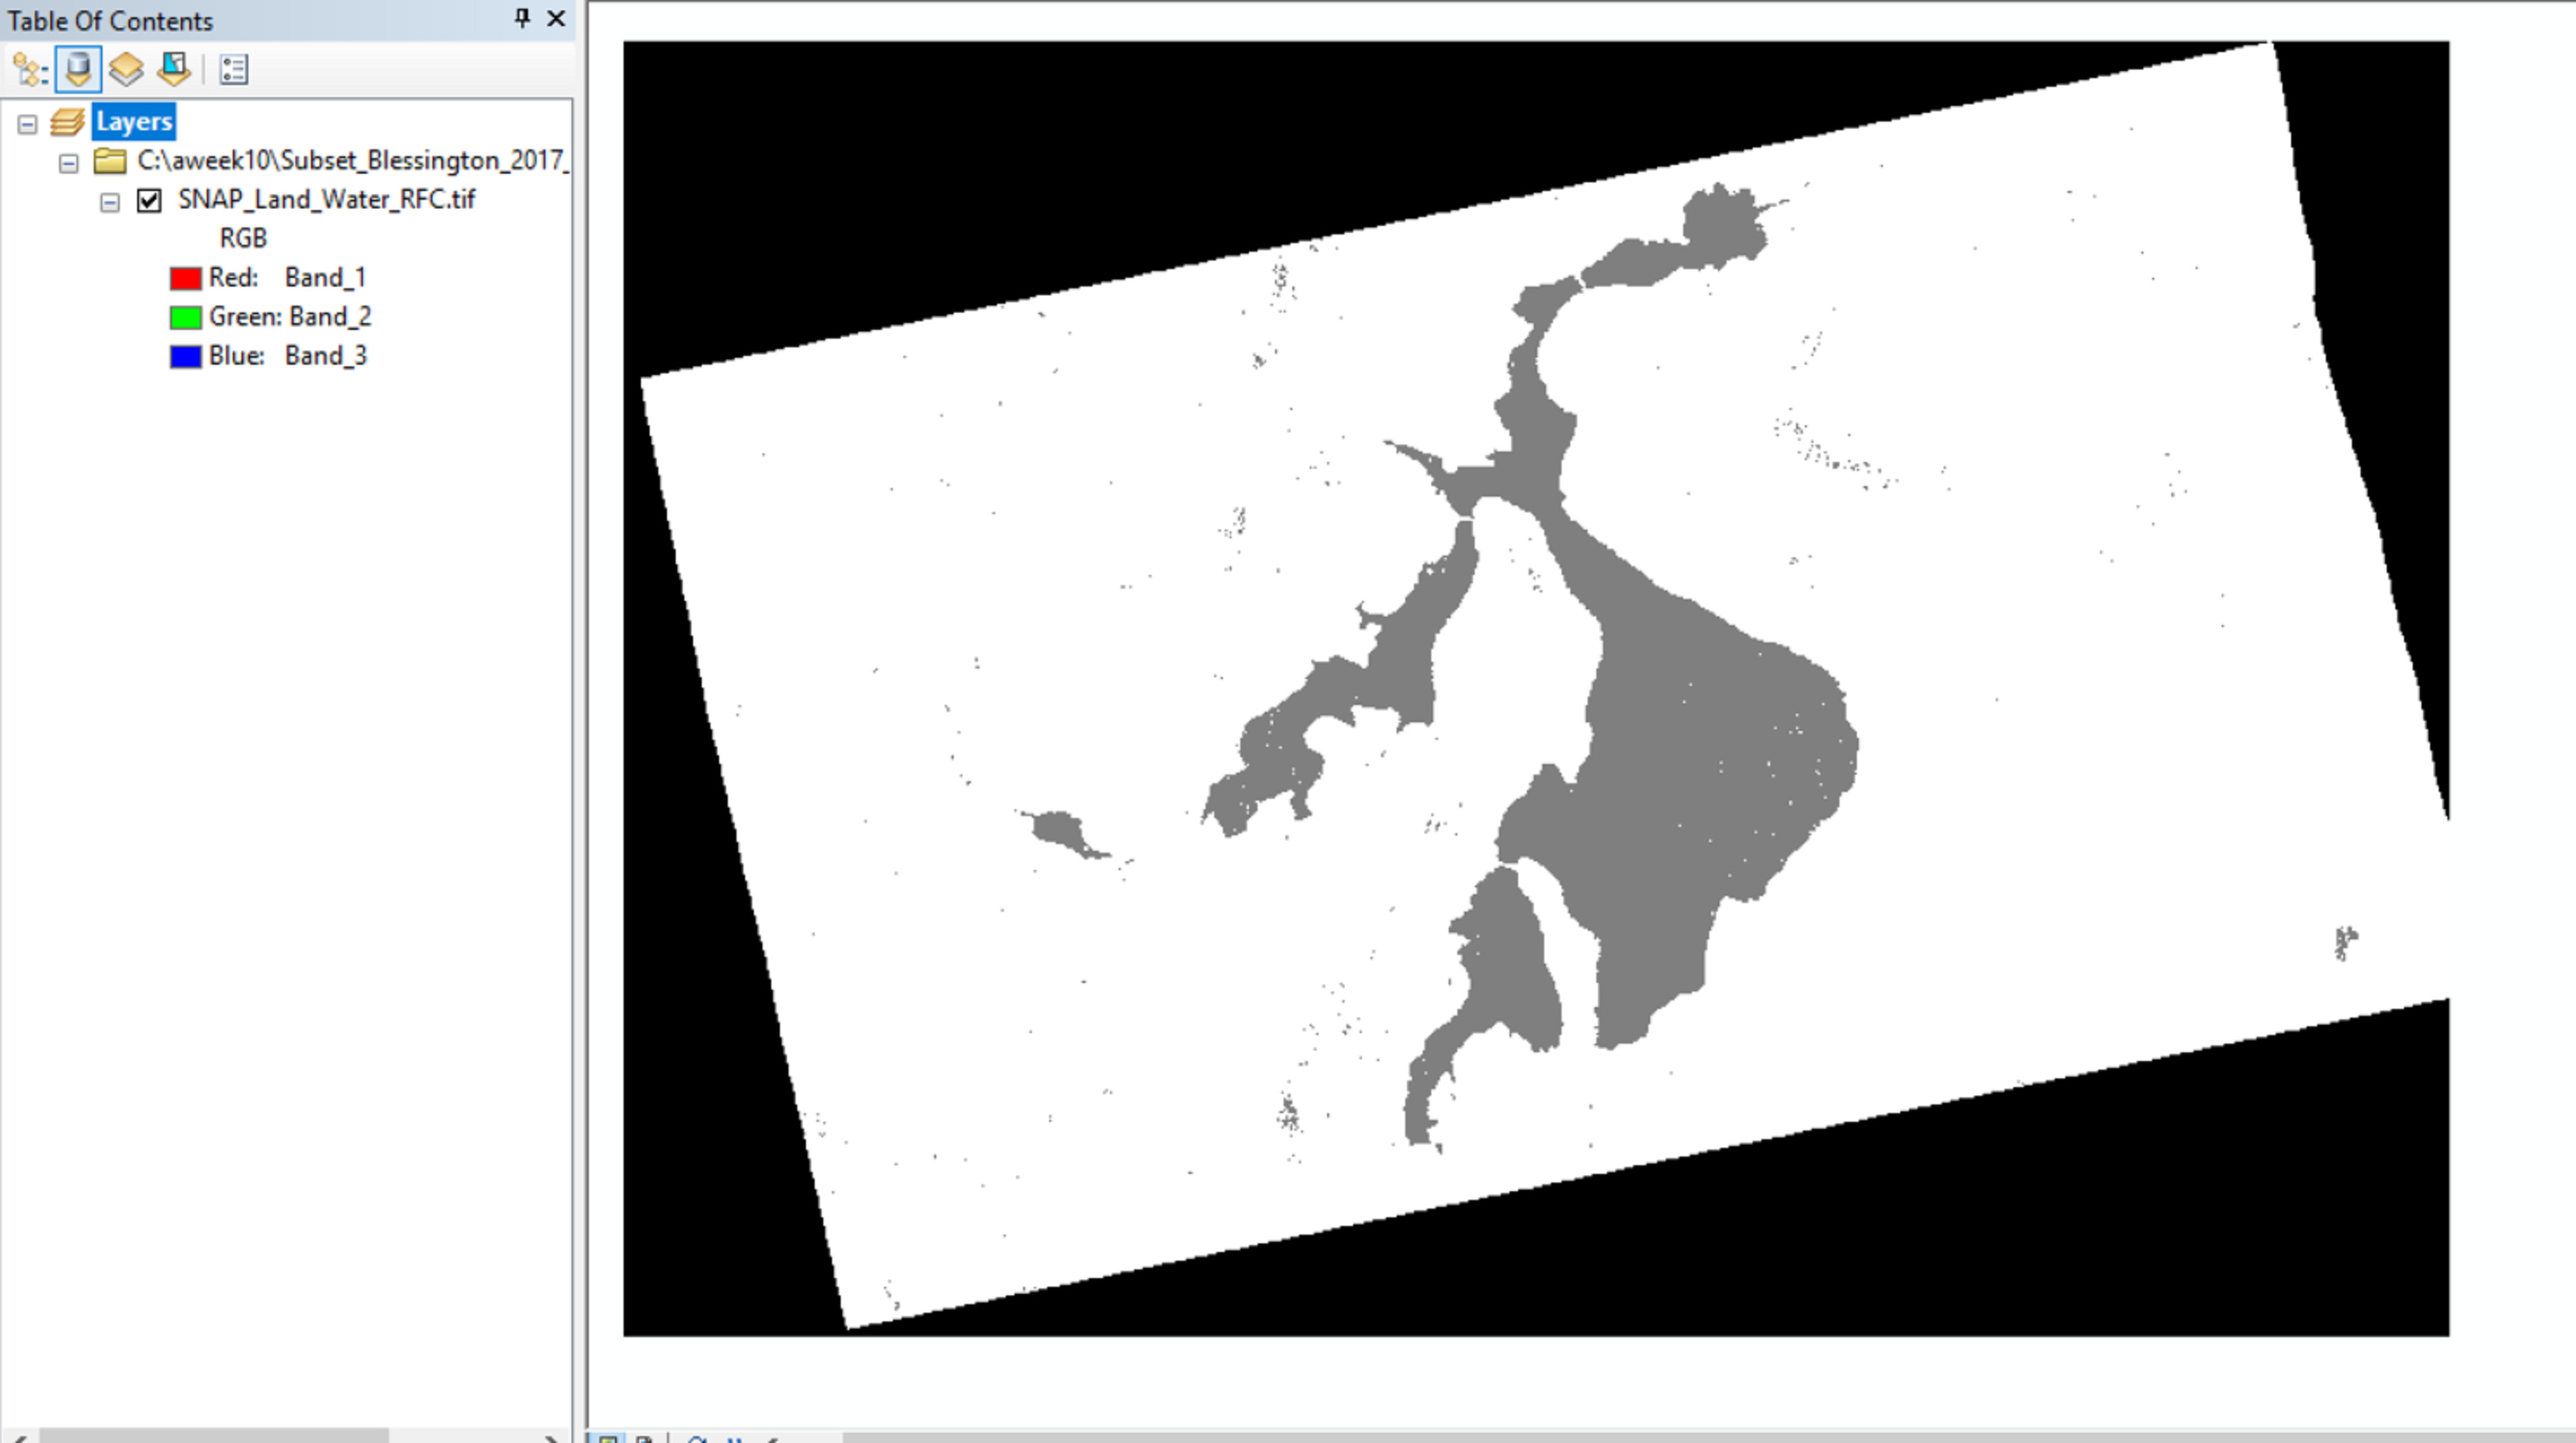
When I try to export the above classified imagery with 2 classes (land and water) by right clicking in SNAP right pane - EXPORT VIEW AS IMAGE - full screen/full resolution option, and open in ArcGIS. It displays RGB imagery as shown below:
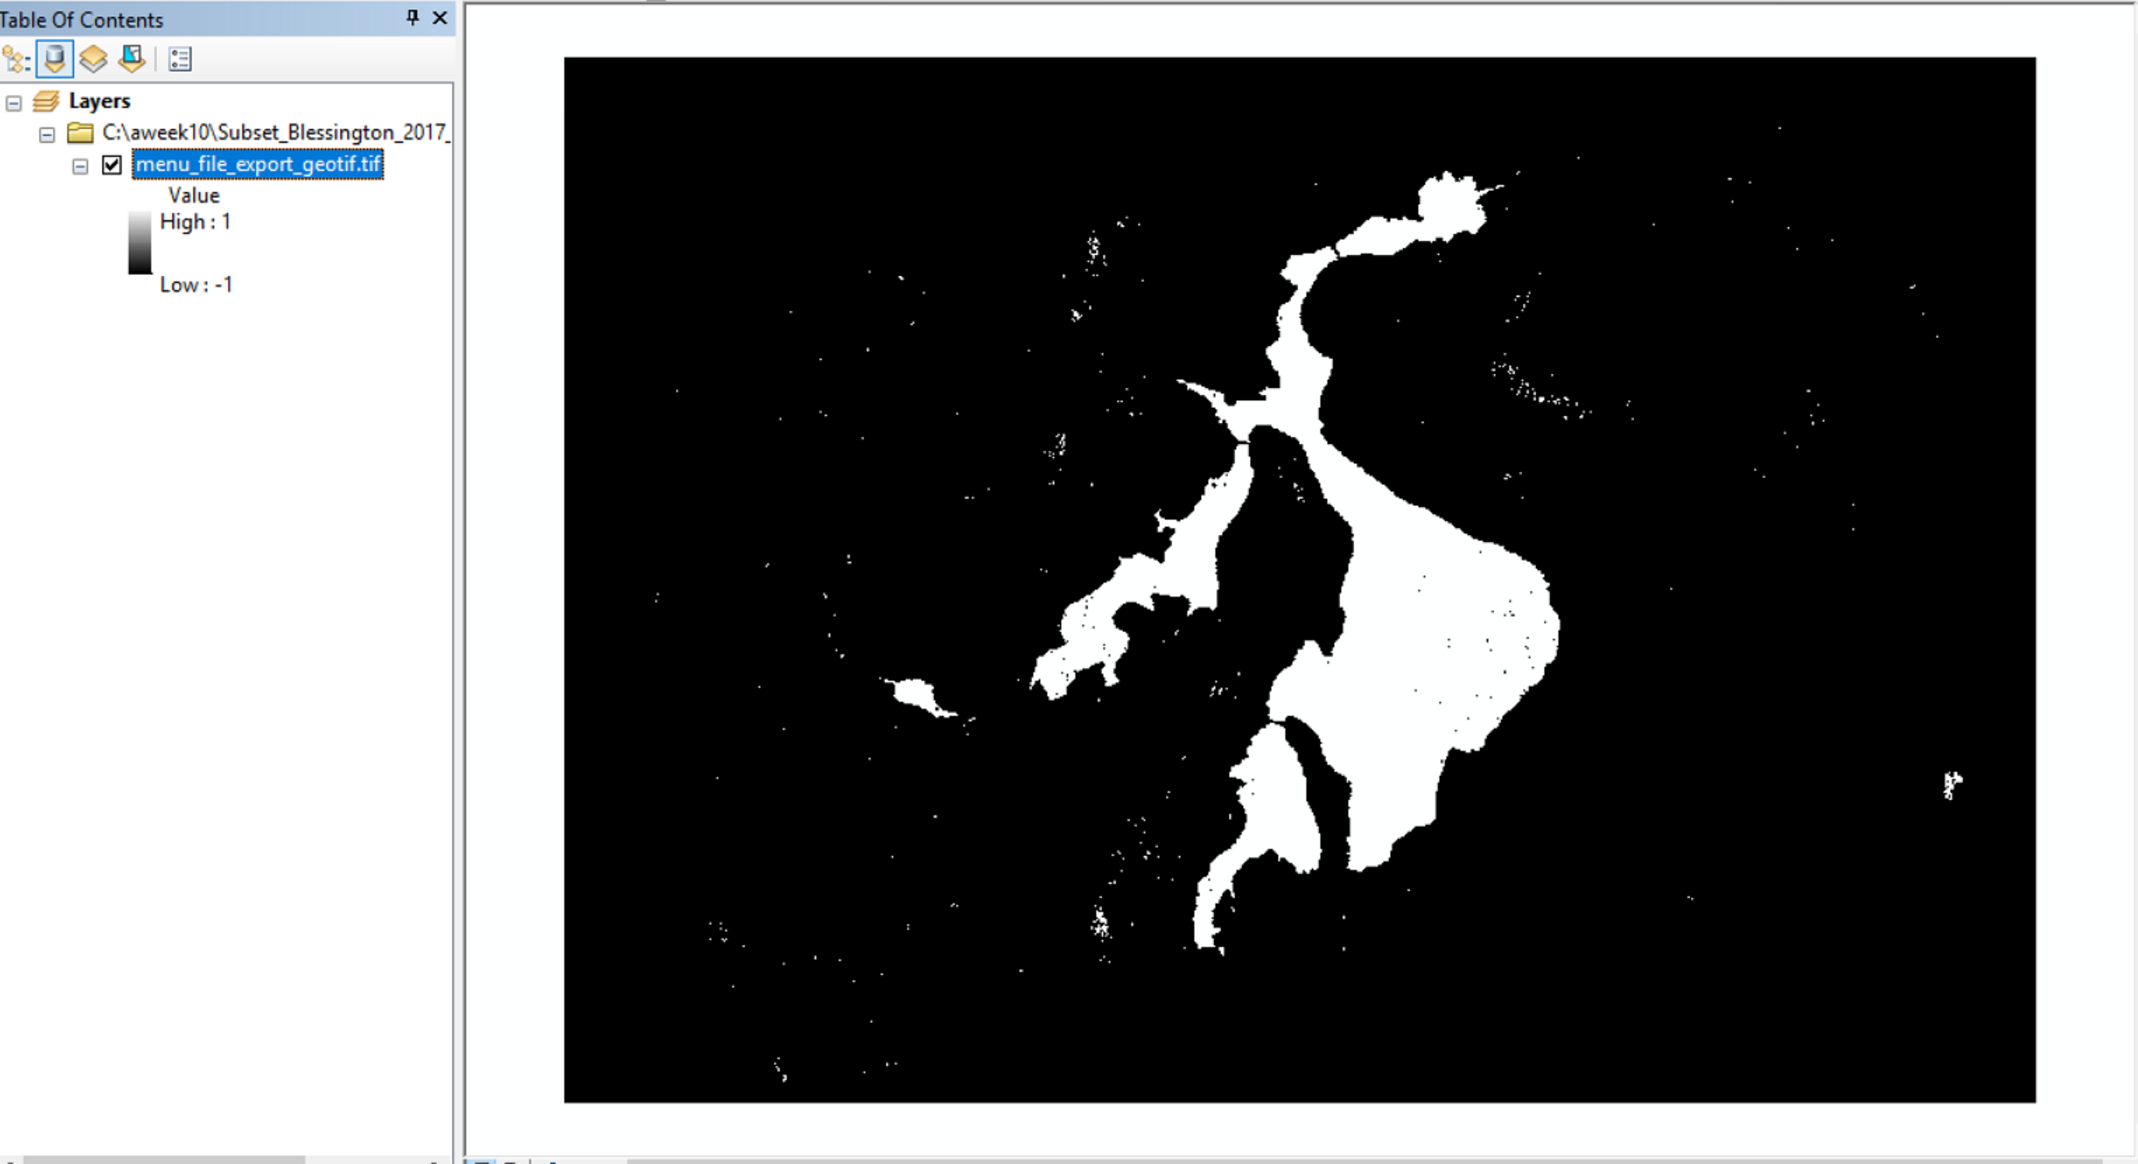
However, if I export the classified imagery using the menu option in SNAP (File-Export-GeoTiff), I got the following display in ArcGIS. Note that in this case image was displayed with a grey scale -1 to +1 value
I was just curious about the difference between the Geotif imagery which was exported by right clicking on the SNAP screen verses the GeoTiff exported through File-Export option.
Also, when I try to do a Raster to Vector conversion of image 2 (one exported through Right on SNAP) works fine without any issues.
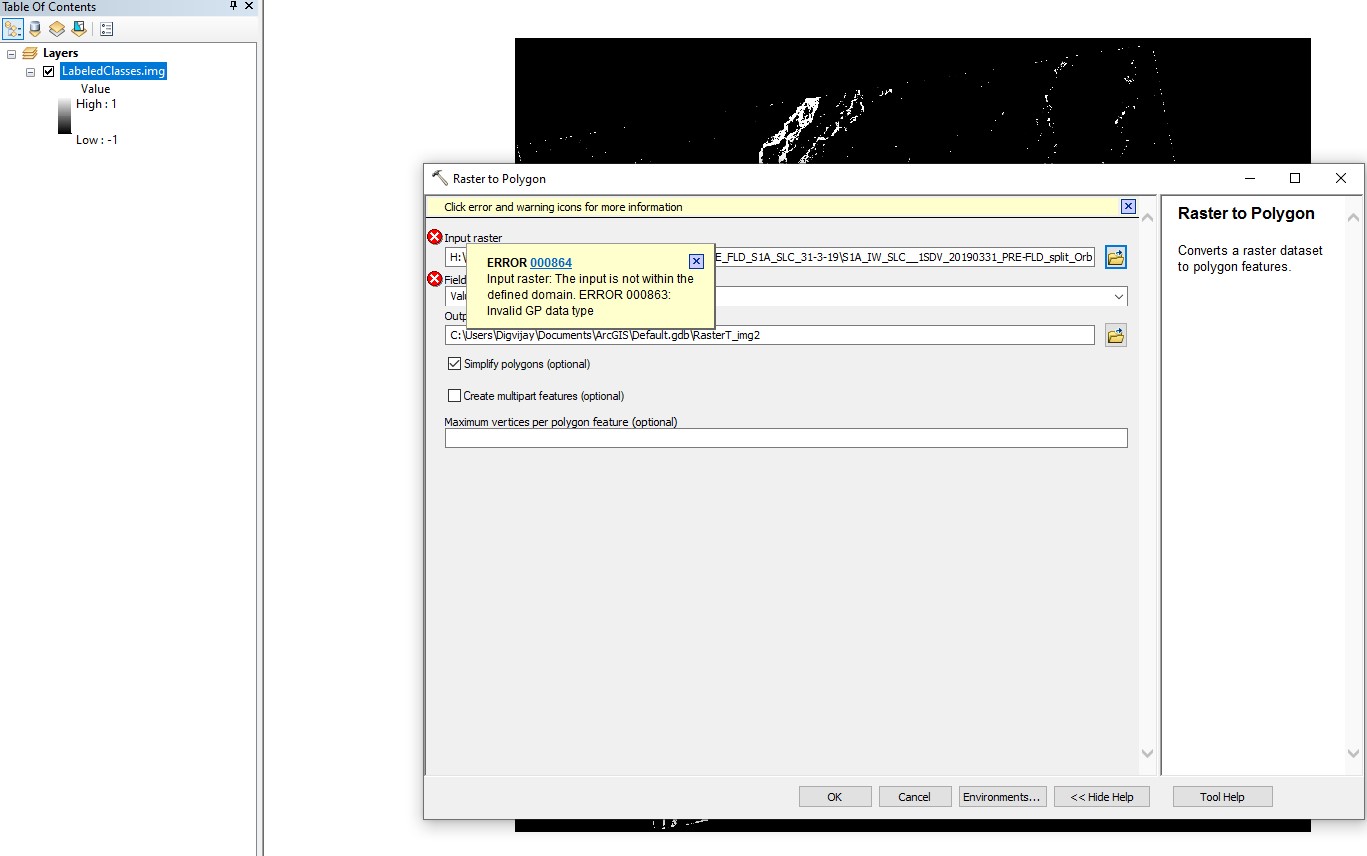
However, when I try to do Raster to Vector conversion image 3 (one exported through File-Export-GeoTiff), I get an error saying that “input raster must be an intiger type”
Drop me a line if you have come across this issue earlier.
My recommendation is to go into the data folder of your classified image product (.dim and .data) and directly open the img file in ArcMap (or any other GIS) without any conversion.
Export often introduces additional bands, rescales the data or translates them to another data type with several unwanted effects (as you show above).
Hello @ABraun sir,
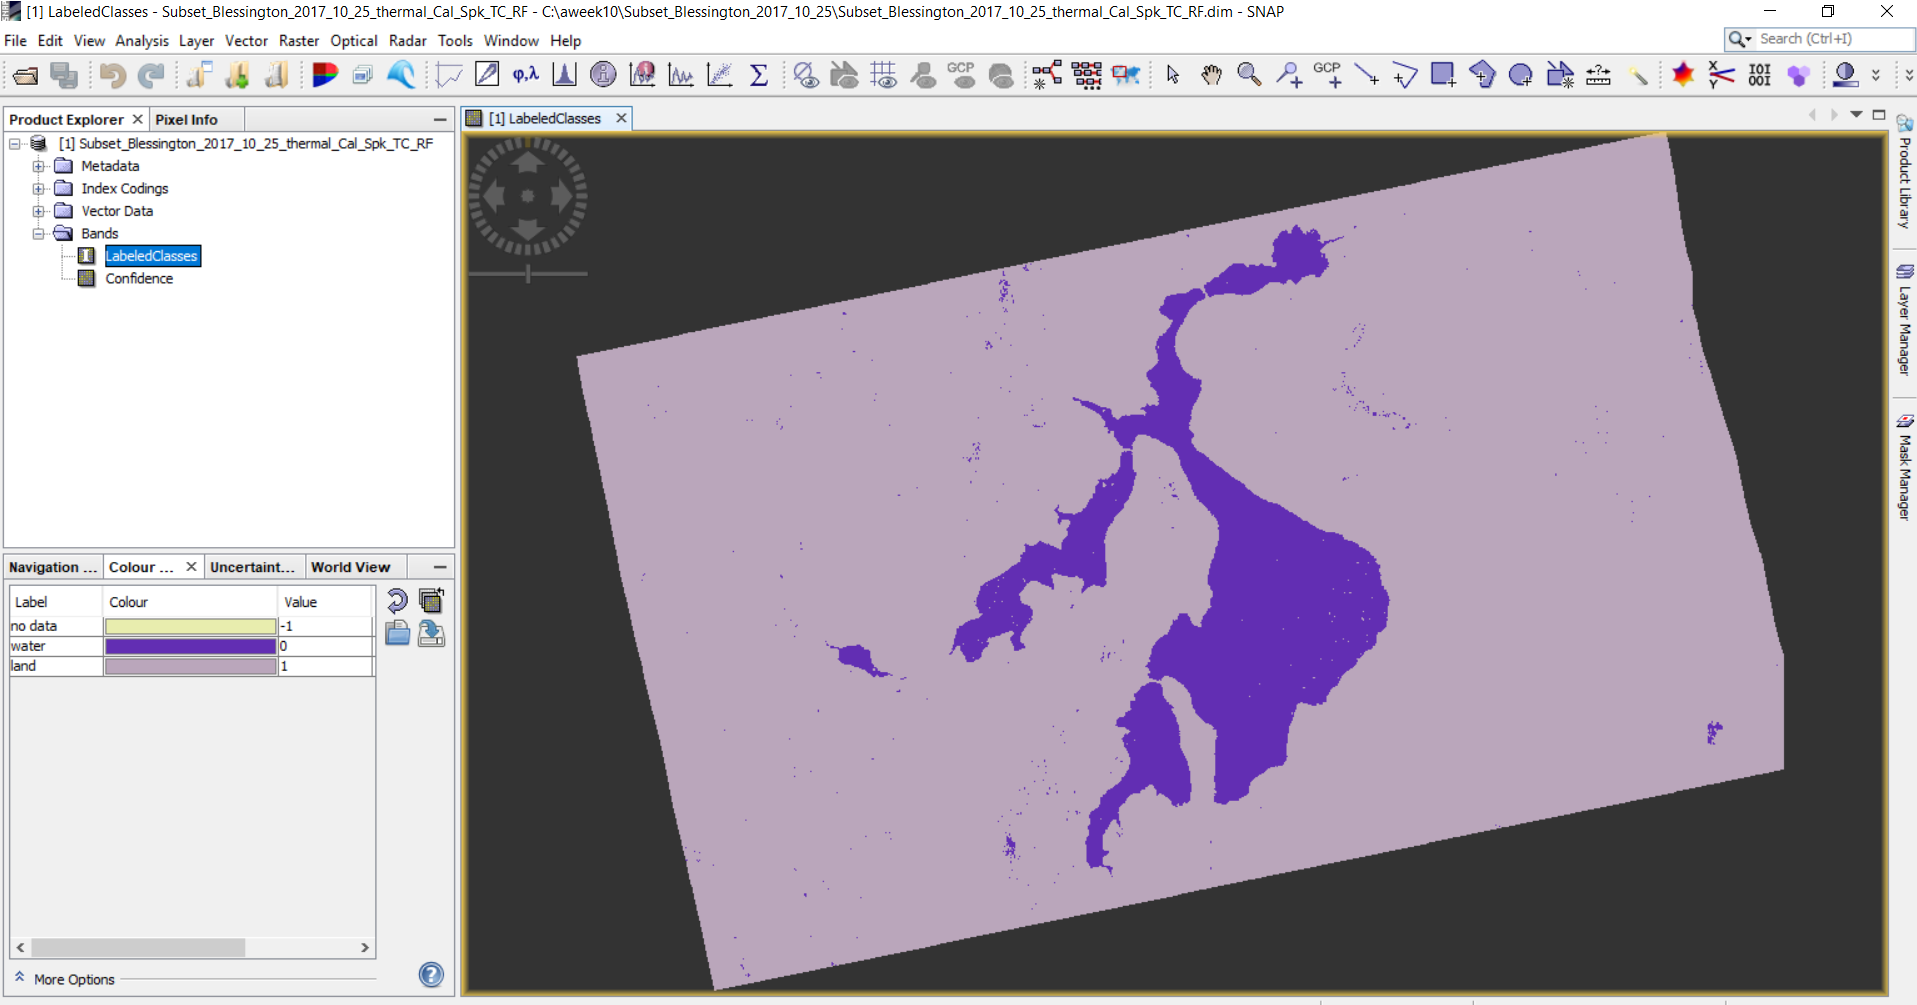
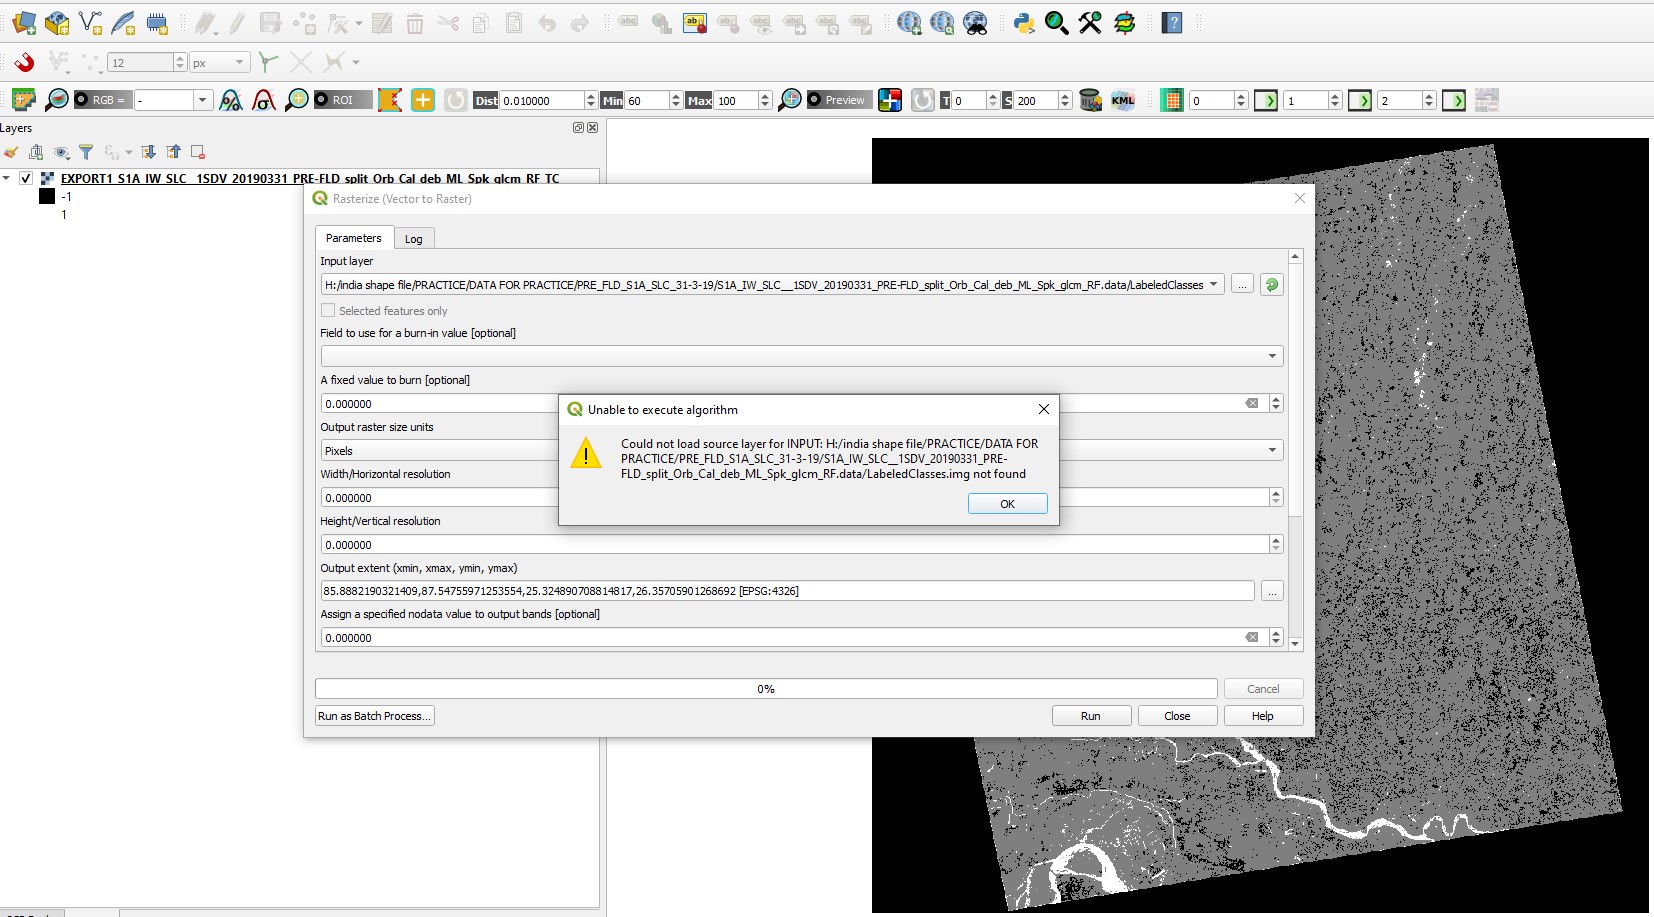
I am new to SNAP and i am trying to classify Sentinel 1 image into binary image with water and non- water classes using supervised Random forest after GLCM analysis. I have read related issues on this forum to solve my error but i am not able to convert the classified image to a vector file. On exporting it to any other software, it is showing different errors.
I applied the confidence<= 0 THEN LABELED CLASS expression as well on classified image and saved it but didn’t work for me.
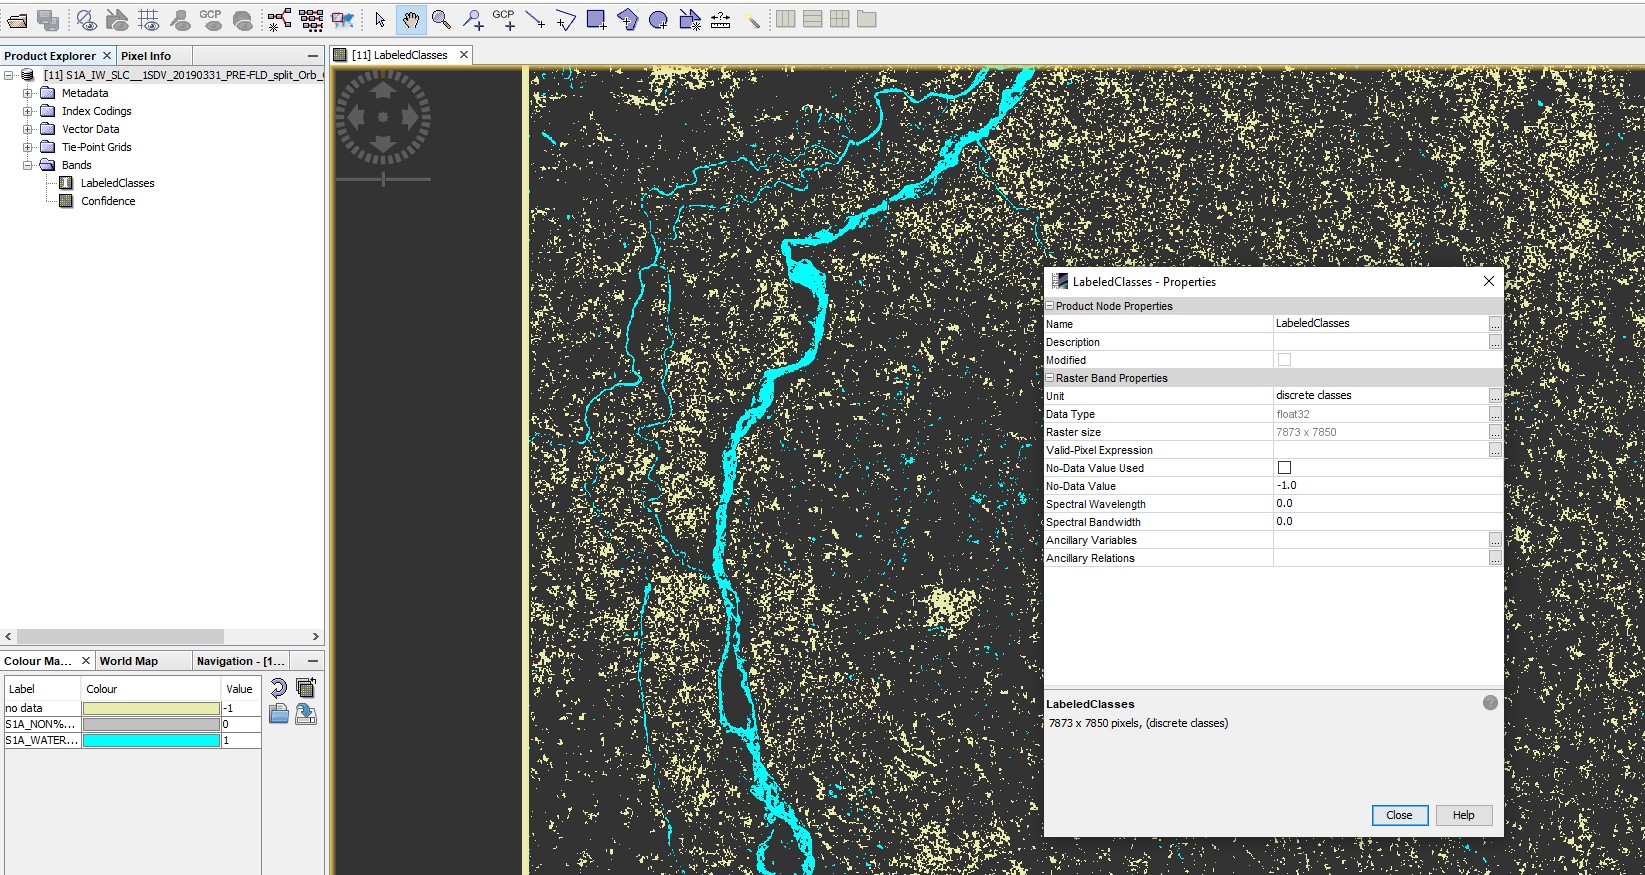
Here is the classified image with properties. One class is assigned 0 value by default. I dont know if that causes this error.
I would have imported the classification the same way you showed in the firs screenshot.
According to this page, the data type of the LabeledClasses causes the error.
Can you please check if the raster is interpreted as Integer or Float (Layer Properties)?
You can use the Convert Datatype tool in SNAP (8 bit, no stretching) and select GeoTiff as an output if the original classification is somehow not liked by ArcMap.
I have just one more query:-
Is it better to feed more feature bands (more in number) into the RF algorithm to let it decide better
OR
to visually identify the bands (mean, dissimilarity, homogeneity, etc) which best discerns water from non-water and use only them for feature band input to the RF algorithm.
Or it depends on the vectors ( Water and non- water samples) more than it does on number of input feature bands.
Thank you in advance!
the RF can deal with redundant input bands, but then needs more iterations so would leave all features in, but increase the number of trees to 100 or even 250.
This, with sufficiently large training areas, should bring the best results.
A random forest is a classifier which repeatedly calculates decision trees (CARTs) based on the training data.
Each tree is trained a different subset of training pixels and constructed using with a random subset of input rasters. This randomization successively identifies the features (input rasters) which are most important for
If your training areas are too small, each tree is trained on the same pixels (5000 at minimum).
If the number of trees is too small, some rasters might have been used only once for constructing a tree, even if it might have been very useful. So, 10 is a quite small number and I recommend 100 if you have a number of rasters (which I assume is the case when you are using image textures)
If the number of features (input rasters) is too small, each tree is calculated on the same rasters, thus making the randomization useless.
This is why you can specify these variables in the classifier: