Rayleigh Correction with GPT loses Spectrum Values

Hi Marco

I’ve found an issue producing a Rayleigh Correction on a Subsetted AOI using a gpt graph, that does not occur in SNAP 9 (or 8).

When producing it with SNAP, I get spectrum values for each band (which I absolutely need):

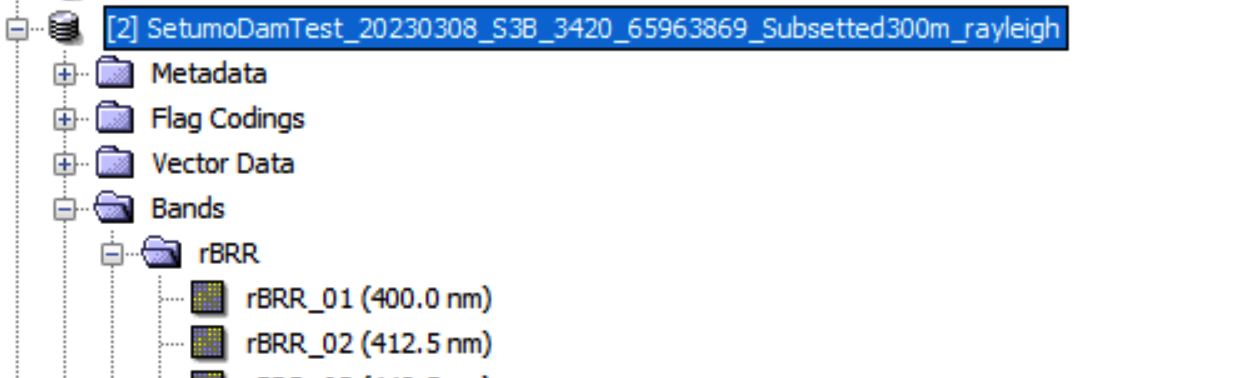
However, using the same Subsetted file and running the graph, we do not get the spectrum values:

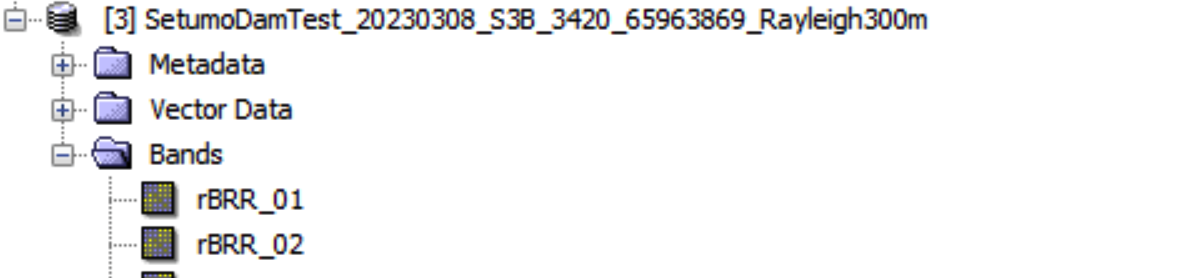
(Running Spectrum View on the graph created imagery displays no values).

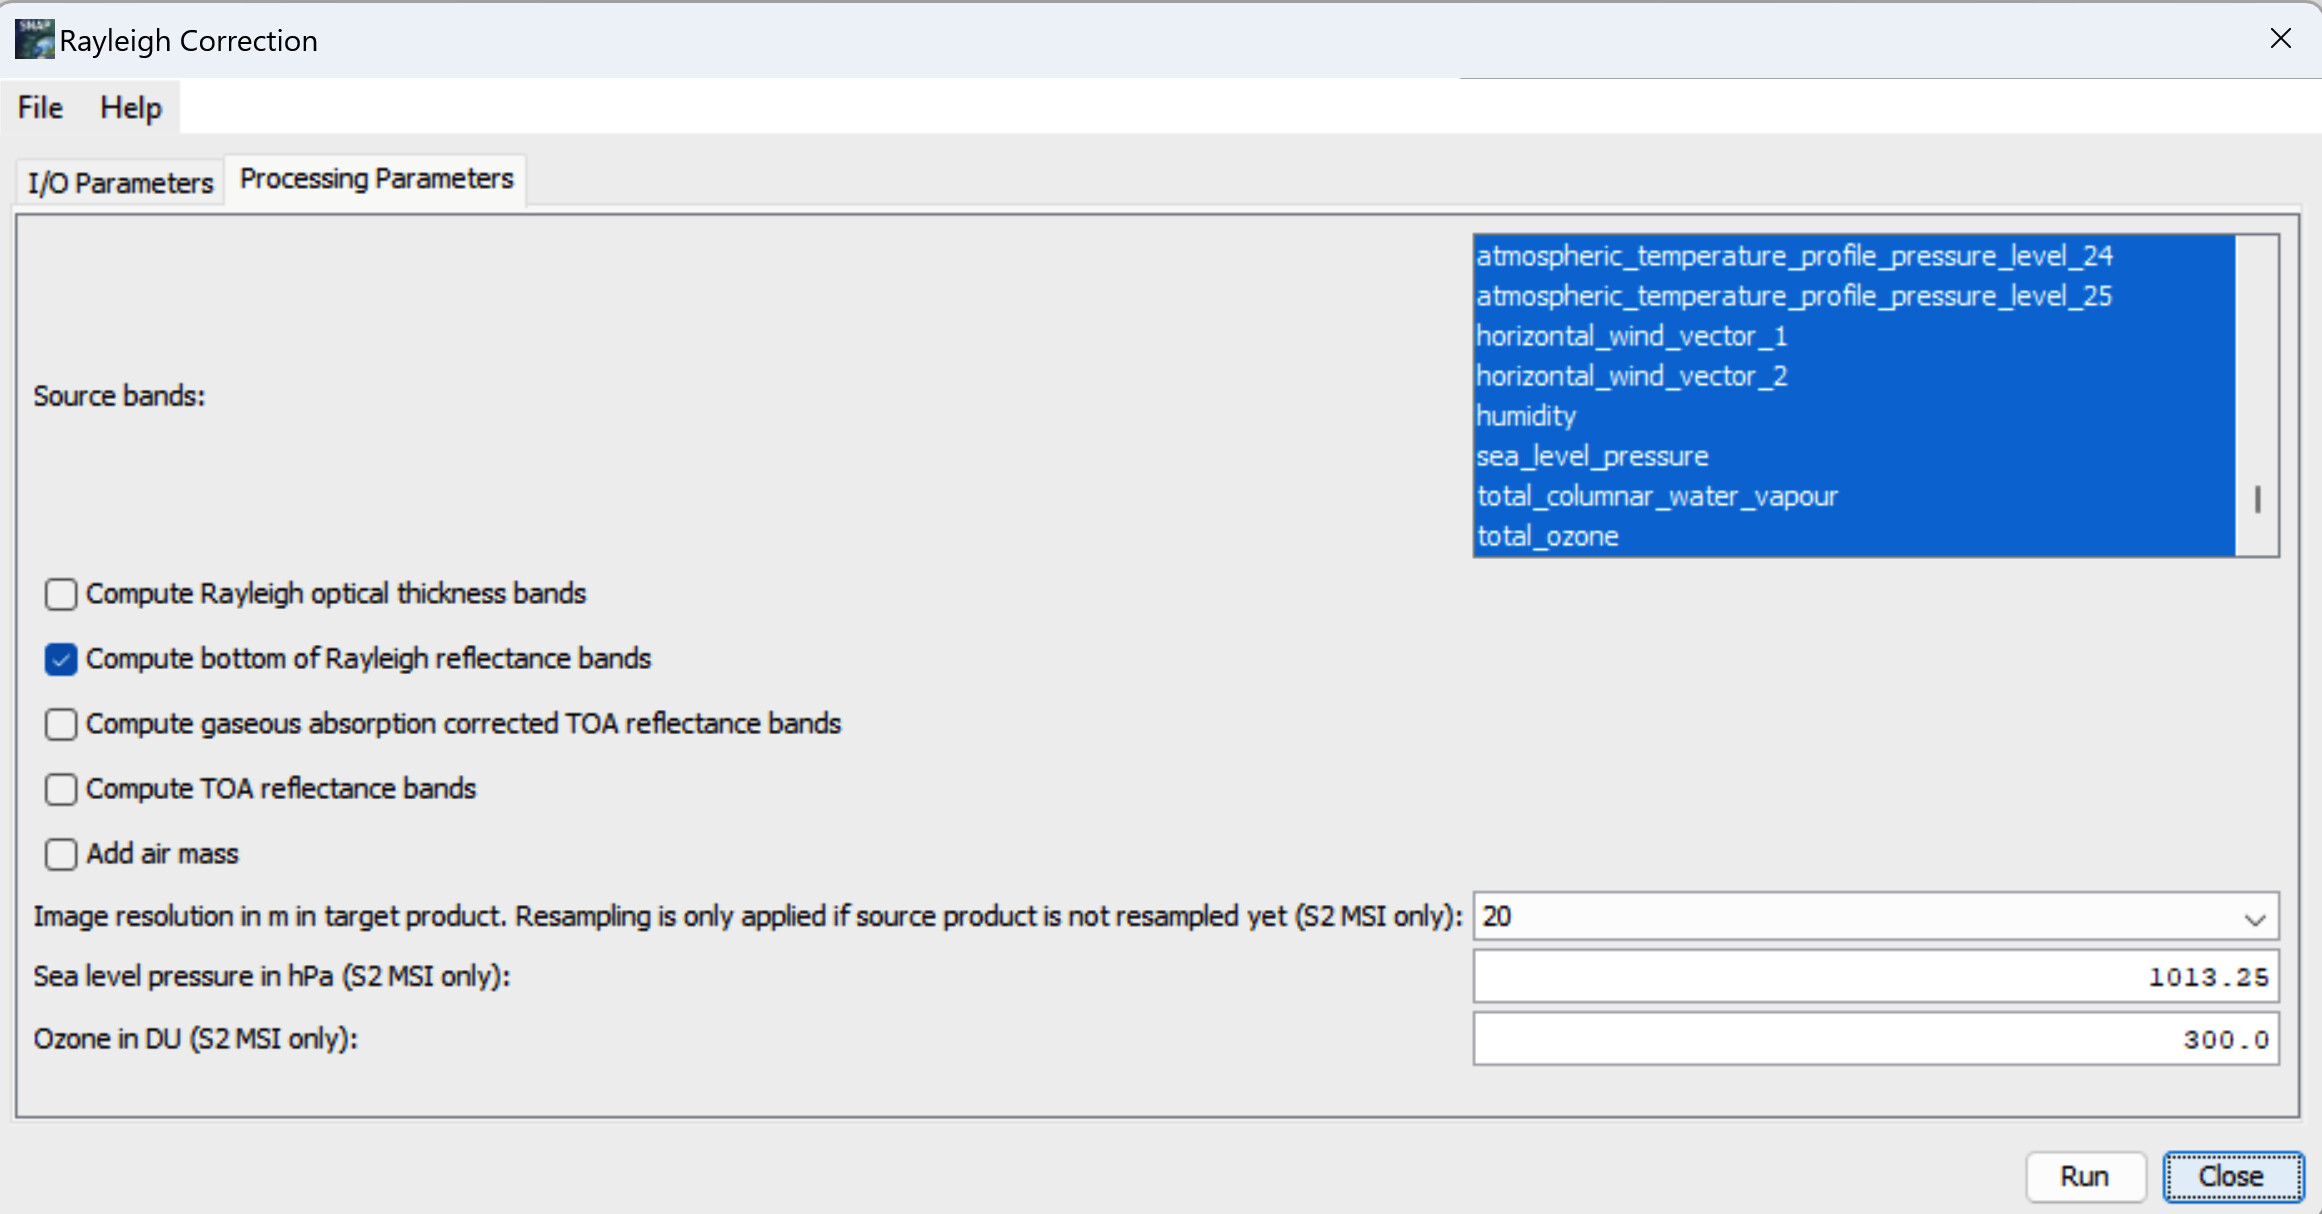
Our graph file mirrors the operation performed in SNAP.

SNAP (all available source bands selected):

graph.xml:

<node id="Rayleigh300m">
    <operator>RayleighCorrection</operator>
    <sources>
      <sourceProduct refid="Subsetted300m"/>
    </sources>
    <parameters class="com.bc.ceres.binding.dom.XppDomElement">
      <sourceBandNames>${Subsetted300mBands}</sourceBandNames>
      <computeTaur>false</computeTaur>
      <computeRBrr>true</computeRBrr>
      <computeRtoaNg>false</computeRtoaNg>
      <computeRtoa>false</computeRtoa>
      <addAirMass>false</addAirMass>
    </parameters>
  </node>

Subsetted300mBands are pulled in from a properties file:

Subsetted300mBands='Oa01_radiance,Oa02_radiance,Oa03_radiance,Oa04_radiance,Oa05_radiance,Oa06_radiance,Oa07_radiance,Oa08_radiance,Oa09_radiance,Oa10_radiance,Oa11_radiance,Oa12_radiance,Oa13_radiance,Oa14_radiance,Oa15_radiance,Oa16_radiance,Oa17_radiance,Oa18_radiance,Oa19_radiance,Oa20_radiance,Oa21_radiance,altitude,latitude,longitude,detector_index,FWHM_band_1,FWHM_band_2,FWHM_band_3,FWHM_band_4,FWHM_band_5,FWHM_band_6,FWHM_band_7,FWHM_band_8,FWHM_band_9,FWHM_band_10,FWHM_band_11,FWHM_band_12,FWHM_band_13,FWHM_band_14,FWHM_band_15,FWHM_band_16,FWHM_band_17,FWHM_band_18,FWHM_band_19,FWHM_band_20,FWHM_band_21,frame_offset,lambda0_band_1,lambda0_band_2,lambda0_band_3,lambda0_band_4,lambda0_band_5,lambda0_band_6,lambda0_band_7,lambda0_band_8,lambda0_band_9,lambda0_band_10,lambda0_band_11,lambda0_band_12,lambda0_band_13,lambda0_band_14,lambda0_band_15,lambda0_band_16,lambda0_band_17,lambda0_band_18,lambda0_band_19,lambda0_band_20,lambda0_band_21,solar_flux_band_1,solar_flux_band_2,solar_flux_band_3,solar_flux_band_4,solar_flux_band_5,solar_flux_band_6,solar_flux_band_7,solar_flux_band_8,solar_flux_band_9,solar_flux_band_10,solar_flux_band_11,solar_flux_band_12,solar_flux_band_13,solar_flux_band_14,solar_flux_band_15,solar_flux_band_16,solar_flux_band_17,solar_flux_band_18,solar_flux_band_19,solar_flux_band_20,solar_flux_band_21',

We’ve run multiple tests with various configurations on this to ensure that we have not provided incorrect inputs, and each gives us the same result.

That’s strange. I just did it and both have the wavelength. One time I processed to BEAM-DIMAP and the other to NetCDF4-CF. Which format have you used?

That’s the graph I’ve used. At the top I’ve added the gpt command in a comment.
rayleigh.xml (2.6 KB)

We’re using BEAM-DIMAP, but I do see a difference in the way you create the subset, which may account for the problem. You’ve included a parameter that I was not aware of:

 <copyMetadata>true</copyMetadata>

I’ll run a test to see if this resolves it, but having said that, using our subsetted file directly in SNAP - which was created without that parameter - does produce the wavelengths in the Rayleigh Corrected output.

I’ve tested again with the copyMetadata property and there’s no difference. Earlier we were not including the non-radiance bands, and thought the issue was related to that, but after having added those source bands it made no difference.

Another thing different from the way you processed it is that you did the subsetting in the same graph, and used the values created there to then do the Rayleigh Correction. Our process writes the subsetted file to a BEAM-DIMAP file (we retain it to then create a version that is Masked to our AOI within the subset in another graph), and then a specific graph to do the Rayleigh Correction using the created subsetted file. Neither the resulting Masked BEAM-DIMP and Rayleigh Corrected BEAM_DIMAP files contain the spectrum information.

We also reproject the Subsetted file to WGS84 before writing (and create a csv file with the values) - and I’m suspecting this is the culprit. Are we incorrectly setting, or missing, a reprojection value here perhaps?

Here is the Subsetting graph:

<graph id="Subsetted300m">
  <version>1.0</version>
  <node id="productFile">
    <operator>Read</operator>
    <sources/>
    <parameters class="com.bc.ceres.binding.dom.XppDomElement">
      <file>/${productFile}</file>
    </parameters>
  </node>
  <node id="Subsetted300m">
    <operator>Subset</operator>
    <sources>
      <sourceProduct refid="productFile"/>
    </sources>
    <parameters class="com.bc.ceres.binding.dom.XppDomElement">
      <sourceBands>${Subsetted300mBands}</sourceBands>
      <region>0,0,10980,10980</region>
      <referenceBand>${referenceBand}</referenceBand>
      <geoRegion>${geoRegion}</geoRegion>
      <subSamplingX>1</subSamplingX>
      <subSamplingY>1</subSamplingY>
      <fullSwath>false</fullSwath>
      <copyMetadata>true</copyMetadata>
    </parameters>
  </node>
  <node id="Subsetted300mReprojected">
    <operator>Reproject</operator>
    <sources>
      <sourceProduct refid="Subsetted300m"/>
    </sources>
    <parameters class="com.bc.ceres.binding.dom.XppDomElement">
      <wktFile/>
      <crs>GEOGCS[&quot;WGS84(DD)&quot;, 
  DATUM[&quot;WGS84&quot;, 
    SPHEROID[&quot;WGS84&quot;, 6378137.0, 298.257223563]], 
  PRIMEM[&quot;Greenwich&quot;, 0.0], 
  UNIT[&quot;degree&quot;, 0.017453292519943295], 
  AXIS[&quot;Geodetic longitude&quot;, EAST], 
  AXIS[&quot;Geodetic latitude&quot;, NORTH]]</crs>
      <resampling>Nearest</resampling>
      <referencePixelX/>
      <referencePixelY/>
      <easting/>
      <northing/>
      <orientation/>
      <pixelSizeX/>
      <pixelSizeY/>
      <width/>
      <height/>
      <tileSizeX/>
      <tileSizeY/>
      <orthorectify>false</orthorectify>
      <elevationModelName/>
      <noDataValue>NaN</noDataValue>
      <includeTiePointGrids>true</includeTiePointGrids>
      <addDeltaBands>false</addDeltaBands>
    </parameters>
  </node>
  <node id="Write">
    <operator>Write</operator>
    <sources>
      <sourceProduct refid="Subsetted300mReprojected"/>
    </sources>
    <parameters class="com.bc.ceres.binding.dom.XppDomElement">
      <file>${Subsetted300m}.dim</file>
      <formatName>BEAM-DIMAP</formatName>
    </parameters>
  </node>
  <node id="WriteCSV">
		<operator>Write</operator>
		<sources>
		<sourceProduct refid="Subsetted300mReprojected"/>
		</sources>
		<parameters class="com.bc.ceres.binding.dom.XppDomElement">
		<file>${Subsetted300m}.csv</file>
		<formatName>CSV</formatName>
		</parameters>
	</node>
</graph>

Properties:

Subsetted300mBands='quality_flags,Oa01_radiance,Oa02_radiance,Oa03_radiance,Oa04_radiance,Oa05_radiance,Oa06_radiance,Oa07_radiance,Oa08_radiance,Oa09_radiance,Oa10_radiance,Oa11_radiance,Oa12_radiance,Oa13_radiance,Oa14_radiance,Oa15_radiance,Oa16_radiance,Oa17_radiance,Oa18_radiance,Oa19_radiance,Oa20_radiance,Oa21_radiance,altitude,latitude,longitude,detector_index,FWHM_band_1,FWHM_band_2,FWHM_band_3,FWHM_band_4,FWHM_band_5,FWHM_band_6,FWHM_band_7,FWHM_band_8,FWHM_band_9,FWHM_band_10,FWHM_band_11,FWHM_band_12,FWHM_band_13,FWHM_band_14,FWHM_band_15,FWHM_band_16,FWHM_band_17,FWHM_band_18,FWHM_band_19,FWHM_band_20,FWHM_band_21,frame_offset,lambda0_band_1,lambda0_band_2,lambda0_band_3,lambda0_band_4,lambda0_band_5,lambda0_band_6,lambda0_band_7,lambda0_band_8,lambda0_band_9,lambda0_band_10,lambda0_band_11,lambda0_band_12,lambda0_band_13,lambda0_band_14,lambda0_band_15,lambda0_band_16,lambda0_band_17,lambda0_band_18,lambda0_band_19,lambda0_band_20,lambda0_band_21,solar_flux_band_1,solar_flux_band_2,solar_flux_band_3,solar_flux_band_4,solar_flux_band_5,solar_flux_band_6,solar_flux_band_7,solar_flux_band_8,solar_flux_band_9,solar_flux_band_10,solar_flux_band_11,solar_flux_band_12,solar_flux_band_13,solar_flux_band_14,solar_flux_band_15,solar_flux_band_16,solar_flux_band_17,solar_flux_band_18,solar_flux_band_19,solar_flux_band_20,solar_flux_band_21'
referenceBand='Oa01_radiance'
geoRegion=<formatted polygon data>

I’ve now tried with your graph (updated it a bit to make it run). I’ve used a properties file for the properties.
Afterwards I used a graph containing only the rayleigh correction. And the wavelength are present.

That’s the first command:
gpt "D:\_UserSupport\donCarlosOne\rayleighFullGraph.xml" -PproductFile="D:\_UserSupport\donCarlosOne\S3A_OL_1_EFR____20200216T101647_20200216T101947_20200217T151343_0179_055_065_2160_LN1_O_NT_002.SEN3" -p "D:\_UserSupport\donCarlosOne\graph.props"

This is the second command:
gpt "D:\_UserSupport\donCarlosOne\rayleigh.xml" -Solci="D:\_UserSupport\donCarlosOne\S3A_OL_1_EFR____20200216T101647_20200216T101947_20200217T151343_0179_055_065_2160_LN1_O_NT_002.SEN3.csv" -t "D:\_UserSupport\donCarlosOne\S3A_OL_1_EFR____20200216T101647_rayleigh3.nc" -f NetCDF4-CF

The files:
rayleighFullGraph.xml (2.7 KB)
graph.props (1.5 KB)
rayleigh.xml (2.5 KB)

I’m a bit clueless …