Hi SNAP team,
I am working on my M.Sc thesis and my project requires me to map paddy growth stages in a district of India. I have a RAM of 8 GB and i3 core processor. i downloaded the Sentinel data previously only to realize latter that its too much load for my poor laptop.
My question is, will I be able to achieve this goal with my laptop capacity using RADARSAT 2 data of 6 months ( 24 days period ) ?
2) If it is possible, then is it possible to extract the growth stage of crop on a particular date between the dates of RADARSAT image acquisition dates ??
Kindly, reply and share links if possible on how to achieve this ? I am novice to SAR imaging and i have limited time on my plate ?
Please help
Agricultural mapping is most effective when you use multitemporal information. Switching to Radarsat data will not automatically solve the problem of data size and you might not cover the parts of the year where rice has the most significant change of backscatter.
Lastly, I think your supervisors should not give you a topic which is completely new to you. A thesis serves as the proof that you can work independently and implement new aspects, not learning a new subject within an unreasonably short time.
How big is your region of interest? If the region is relatively small you can look for workflows that start by extracting data for a subset that include your region. If you can upgrade your system, the most important upgrades are more RAM and a solid-state “disk” (SSD).
Thank you so much for the prompt reply.
I understand that its a new and difficult topic to deal with. But, i am a wildlife researcher and its a small part of my project but the most exciting and interesting aspect. Hence, i spent the last month understanding the concepts SAR poliametric imaging. The practical aspects is different issue as you have mentioned, but i will manage it somehow, with a little help of SNAP team hopefully.
Thank you for the link, its very helpful.
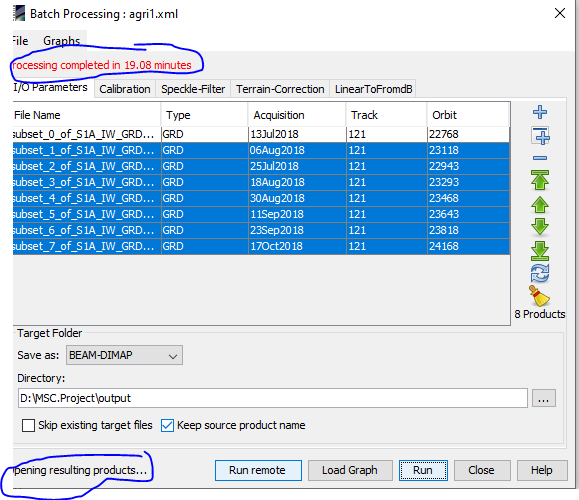
I am attempting a test run on time series of 7 dates and have managed till batch processing. The SNAP application says batch processing complete in 19 minutes , but opening result products has taken almost an hour and half. Is it normal ??
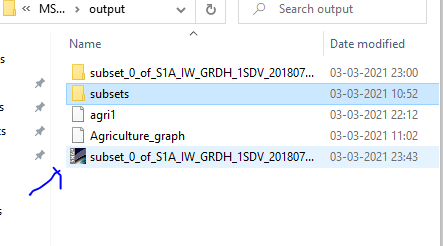
And my output file just shows the first product of batch processing, not the rest 6 as it ideally should?
some issue with uploading the jpg and png image.
Please help with the minor doubts , i would post to execute the time series.
Regards
Ajit Sahu
Upgrading is not possible in such a short period of time. Due to pandemic, cannot visit my lab for processing.
I am trying to manipulate my sample sets from a smallest area (100 km radius) possible to make the project work. I have subset the area and running the application. I have reached till Batch processing.
Actually, the batch progressing should produce one output for every file in the list.
It works best if you create the graph with one input product and define an output name with a suffix (_TC.dim) in the write tab.
Then load all products into the batch processing and make sure that the first dataset in the list is the one from the graph. When you start the batch processing, all other outputs are renamed accordingly.
Than you for your suggestion.
Initially , i had extracted the zip files after downloading, and perhaps that was the reason for not processing.
but when i tried batch processing on a new set of data, i was able to batch process it, with sufficient efficiency. YAYYYY
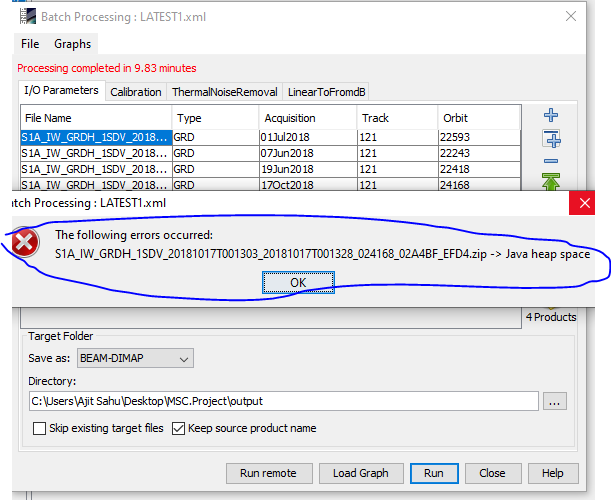
however, this error came on the processing.
What are the reasons for java heap space and how can i sort it ?