Hello, is anyone having a tutorial on SENTINEL -1 Radar vegetation Index(RVI) calculation. in SNAP or ArcMap. i will be grateful. I don’t seem to find any on YouTube
Maybe these links could help you:
https://documentation.dataspace.copernicus.eu/APIs/openEO/openeo-community-examples/python/RVI/RVI.html
1 Like
thanks Diana, i preferred to use SNAP directly. am not good at programming. But thanks
I’m not a SAR expert, but in general you should do:
- TOPS Split (only for SLC, skip for GRD)
- Apply Orbit file
- Thermal Noise Removal
- Calibration to Sigma0
On the result you can add a RVI band using band maths and the expression:
(4 * Sigma0_IW1_VH) / (Sigma0_IW1_VV + Sigma0_IW1_VH)
1 Like
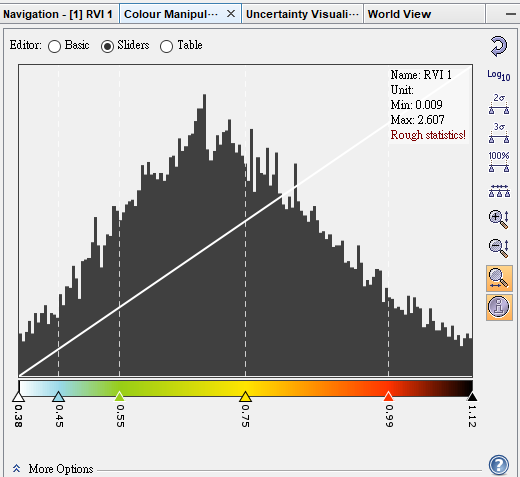
Someone help me understand which values i consider as the RVI values from the above screenshots i have attached.
is is 0.3843730 to 1.1203202 or 0.009 - 2.607
i will grateful for the reply
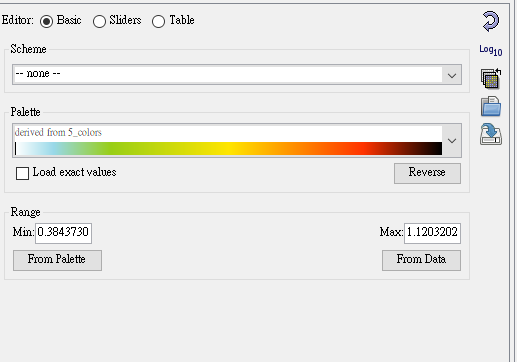
0.3843730 to 1.1203202 is the range where the colour palette is defined by default.
0.009 - 2.607 is the range of your data. So, these are the RVI values.
You can click on From Data the colour palette will use the data range
1 Like
Thanks so much. i get it. the RVI ranges between 0.009-2.607. the value of 2.607 is above the normal RVI range of 1. How can this be normalized.
You can use a normalisation function: (xi – min(x)) / (max(x) – min(x))
So, in your case: (RVI - 0.009) / (2.607 - 0.009)
1 Like
To normalize your RVI values, you can use the formula shared by Marco_EOM: (RVI - 0.009) / (2.607 - 0.009). This will adjust your values to fit between 0 and 1. SNAP is great for such calculations, and if you need extra help, tutorials can make it even easier.