Hey Guys,
I do not know for sure if I can ask this stuff here, since I am not using SNAP for my Analysis.
I am trying to do a TimeSeries in Google Earth Engine for Pixels in a lake in Sweden. But I get very different Values for different Images that were taken right after another, I am pretty sure that this might be because of differences in the incidence angle.
According to the website of GEE, they do the following preprocessing themselfes:
- Apply orbit file
- GRD border noise removal
- Removes low intensity noise and invalid data on scene edges. (As of January 12, 2018)
- Thermal noise removal
- Removes additive noise in sub-swaths to help reduce discontinuities between sub-swaths for scenes in multi-swath acquisition modes. (This operation cannot be applied to images produced before July 2015)
- Radiometric calibration
- Computes backscatter intensity using sensor calibration parameters in the GRD metadata.
- Terrain correction (orthorectification)
- Converts data from ground range geometry, which does not take terrain into account, to σ° using the SRTM 30 meter DEM or the ASTER DEM for high latitudes (greater than 60° or less than -60°).
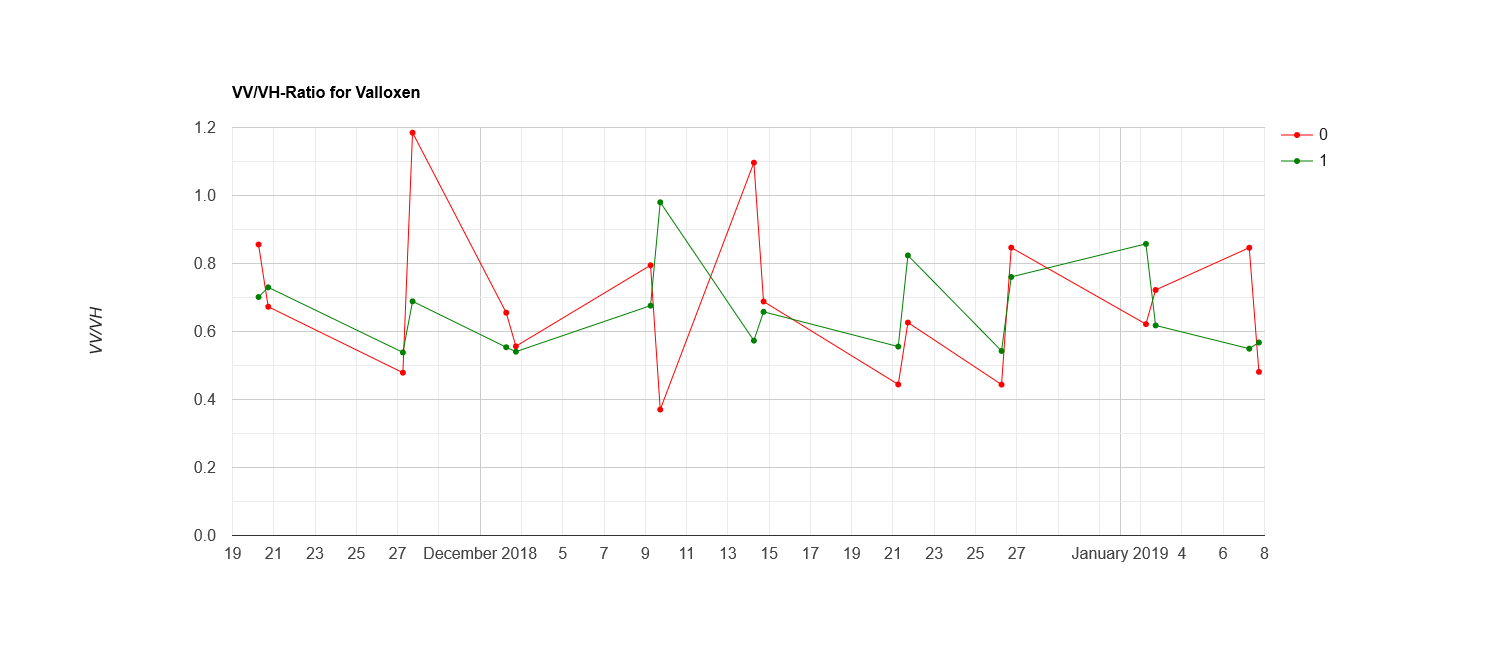
Here u can see my result:
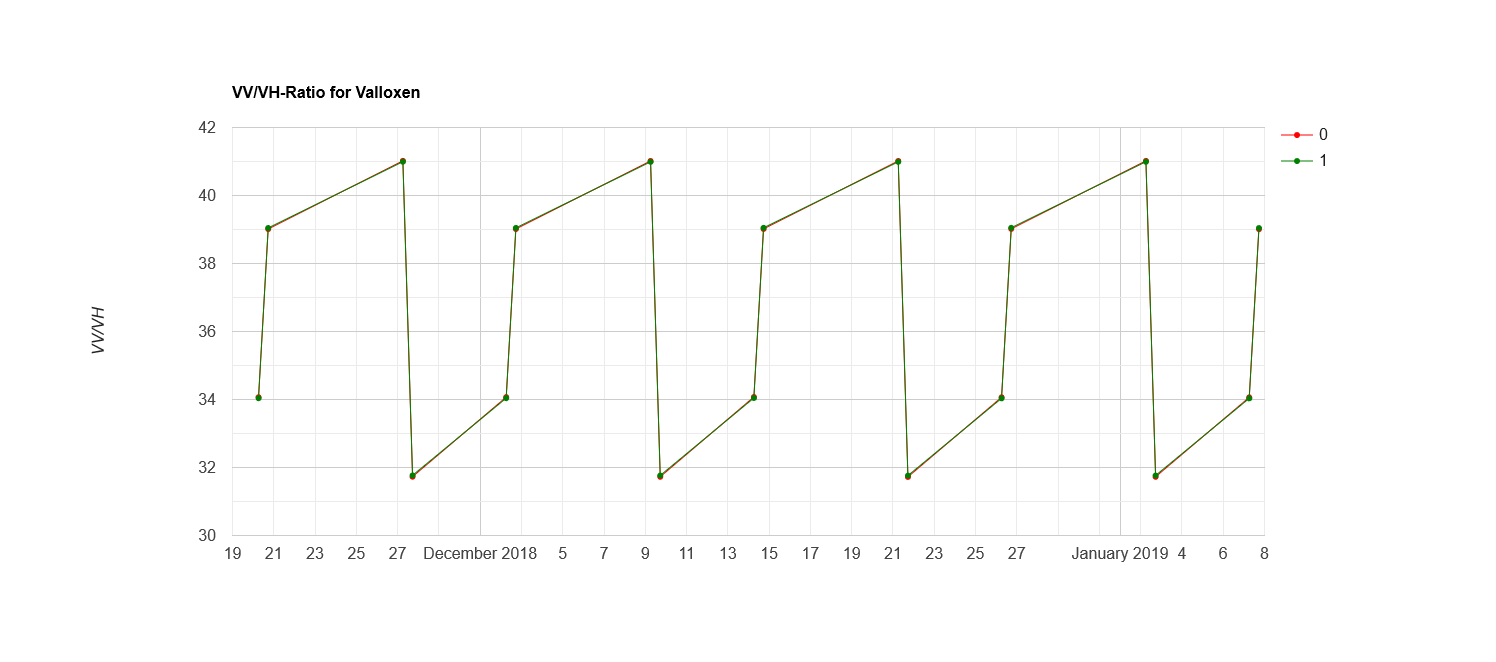
Here is a chart of the angle-values: (Ignore the y-axis name, I just did not change the code)
As you can see, for the 27th of Novembre, there are two very different Values for VV/VH, even though there might be some differences, they should not be that big.
Is there a mathematical way to correct for the incidence angle by now? I found this topic Incidence angle correction of Sentinel 1 - #8 by Chen but it did not really help me.
Edit: I just realised, I did the same Preprocessing (+Speckle Filtering) in SNAP to get a first time series, but did not check the angles. So the problem should also be apperaing in SNAP if I downloaded all available data?
With best regards,
Felix
Hi,
In some applications, incidence angle normalization of SAR data might be required if you are working on a single SAR scene. let’s say you try to identify sea ice types over the Arctic, due to the wide incidence angle, same sea ice type located in both near and far range might exhibit different backscatter signatures. Hence, this scene can be corrected for the incidence angle.
In your case, where you want to create a time-series product, i do not think incidence angle normalization is the most important step in your flowchart. Once, you collect all images, you can stack them. So, as long as all images acquired under the same incidence angle, there is no problem proceeding with your analysis.
In terms of the changes you see in backscatter signature for each image, it has to do with the weather conditions under the image was acquired (i suppose). As in Arctic, weather changes every hour, so collecting many images throughout the day, you will see significant changes on the image intensity.
Hi johngan,
thank you for your response!
In my case I want do compare time series for a really big area (Basically whole scandinavia), because I want to define a treshhold based on my values.
Right now I am only differencing between descending/ascending orbits, which deleted the problem shown here in my second plot. But the results look a little off the expectations, so I thought I might be able to use angle correction to change this.
I do not really have an understanding on what you are trying to achieve. Apparently, you are doing some observations over a lake in Scandinavia?
Answering the following questions, might help to understand your problem:
- What months of the year are the observations taking place? if it-s winter then
- What is that you are observing on the lake using time series data?
- Are you trying to derive information of lake thickness over a certain period of time?
- Are you looking at areas of the lake where ice can be thinker, hence, more dangerous?
Ok sorry, was kinda bad described.
My final task is to derive an idea of detecting the occurence of Lake Ice in Scandinavia using S1-Data.
By now (why I do the time series) I am trying to find treshhold values for either VV or VH or any combination (right now VV/VH, or VV-VH/VV+VH) that show change in time on an example lake in Germany, but this should not make a difference (hopefully) for my final result. It is just easier to get Ground-Truth data from sentinel2 to check when ice occured first in germany in comparison to scandinavia.
Hope you now got the idea behind/reason for my question.
In order to confidently detect ice on the lake, you need to know when the melt period as well as the winter period starts. Different backscatter energy is received between melting and winter periods. You can also find online some lookup tables that relate the values of SAR backscatter intensity (for C-bands) in winter and melting period so you know what values (roughly) to expect.
The backscatter intensity across the lake is expected to vary a bit as it is a function of incidence angle. You can apply angle normalization for each SAR scene. What we want to achieve by performing angle correction, is a better separation between ice and open water (ponds) on the lake. Usually, an incidence angle above 35 deg is preferred that achieves better separation compared to steep incidence angles (you need to do experiment yourself).
Once each scene is corrected for the angle, you can stack them all and see what differences you observe, or you can perform a supervised or unsupervised classification.
Yeah exactly that correction for the incident angle for each scene is what I am looking for right now. But I did not find something myself, a co worker helped me with a formula which is basically:
Gamma = VV - (10* log(cos(angle)*PI/180))
I do not know where he got this and he does not either, so I can not tell anything about it, and the changes are really small over all if I use this.
I found a lot of literature of the usage of SAR-data to detect when the ice is melting again, but I did not find quite a lot for the freeze onset so far.
You could try using the normalised polarisation ratio instead and see if it improves things.
Your ratio (in dB) is VV-VH
The normalised ratio (in dB) is (VV-VH)/(VV+VH)
I already used the normalised ratio  I just did not set the brackets. But thanks for your efforts anyway
I will check what they did and try to use it! Thank you
I’m not convinced the changes are something that can be “corrected” away. If the lake is not frozen waves on the surface (and their orientation) can change in half an hour or less, strongly affecting backscatter. And since you are using ascending and descending acquisitions, even if the waves stayed the same you would be observing them from two different directions altogether.
ps. you could try and see if 6-day coherence detects freezing or not - worth a shot IMO
I am wondering which effect small scale stuff like waves has on a pixel of the used size, the influence should be quite low shouldnt it?
I will look into this 6-day coherence, even though that might be difficult since SLC data is not available in GEE by now.
Radar is very sensitive to roughness at the wavelength-scale that for S-1 is 5.4cm. Surface waves can make a pixel bright while dead calm water reflects all the energy away from the sensor and can appear very dark.
You can try producing 6-day coherence with SNAP 
Yeah I know about the usability of SNAP but to do this I have to download all the data by hand etc… Obviously possible but EE is just more comfortable. But I will give it a chance! Thanks for your help
Well you could use a Copernicus DIAS that already has the data you need - all DIASes allow you to run SNAP:
https://www.copernicus.eu/en/access-data/dias
Wow! I definitly did not know this feature. Thank you very much!
Edit: Do you happen to know which one of the DIAS is best for my possible usage? I will read carefully tomorrow, but if you already did something like this before it would be nice!
Hi Marcus,
Could this normalized polarization ration be applied to detect urban area?
Or do you have any other suggestions!