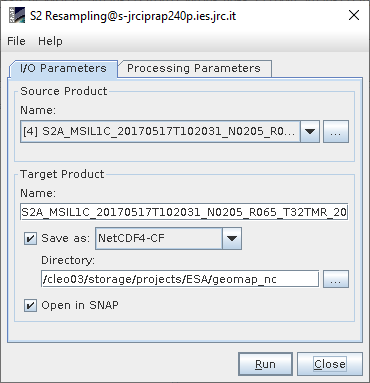
gdalinfo needs a single grid data set. Your screen capture isn’t readable on this laptop screen, but I’m guessing you used the filename without specifying the subdataset. Here is an example from a NASA standard mapped image:
$ gdalinfo A2006167181000.smi_chlor_a_mn.nc
Driver: netCDF/Network Common Data Format
Files: A2006167181000.smi_chlor_a_mn.nc
Size is 512, 512
Coordinate System is `'
Metadata:
  NC_GLOBAL#cdm_data_type=grid
  NC_GLOBAL#Conventions=CF-1.6 ACDD-1.3
[...]
Subdatasets:
  SUBDATASET_1_NAME=NETCDF:"A2006167181000.smi_chlor_a_mn.nc":chlor_a
  SUBDATASET_1_DESC=[768x768] mass_concentration_of_chlorophyll_in_sea_water (32-bit floating-point)
  SUBDATASET_2_NAME=NETCDF:"A2006167181000.smi_chlor_a_mn.nc":chlor_a_stdev
  SUBDATASET_2_DESC=[768x768] mass_concentration_of_chlorophyll_in_sea_water (32-bit floating-point)
  SUBDATASET_3_NAME=NETCDF:"A2006167181000.smi_chlor_a_mn.nc":palette
  SUBDATASET_3_DESC=[3x256] palette (8-bit unsigned integer)
Corner Coordinates:
Upper Left  (    0.0,    0.0)
Lower Left  (    0.0,  512.0)
Upper Right (  512.0,    0.0)
Lower Right (  512.0,  512.0)
Center      (  256.0,  256.0)
Note the “subdataset” entries, for example:
$ gdalinfo NETCDF:"A2006167181000.smi_chlor_a_mn.nc":chlor_a
Driver: netCDF/Network Common Data Format
Files: A2006167181000.smi_chlor_a_mn.nc
Size is 768, 768
Coordinate System is `'
Origin = (-78.000002546447192,45.999998728019783)
Pixel Size = (0.020833339964706,-0.020833332504412)
Metadata:
  chlor_a#display_max=20
  chlor_a#display_min=0.0099999998
  chlor_a#display_scale=log
  chlor_a#long_name=Chlorophyll Concentration, OCI Algorithm
  chlor_a#reference=Hu, C., Lee Z., and Franz, B.A. (2012). Chlorophyll-a algorithms for oligotrophic oceans: A novel approach based on three-band reflectance difference, J. Geophys. Res., 117, C01011, doi:10.1029/2011JC007395.
  chlor_a#standard_name=mass_concentration_of_chlorophyll_in_sea_water
  chlor_a#units=mg m^-3
  chlor_a#valid_max=100
  chlor_a#valid_min=0.001
  chlor_a#_FillValue=-32767
  lat#long_name=Latitude
  lat#standard_name=latitude
  lat#units=degrees_north
  lat#valid_max=90
  lat#valid_min=-90
  lat#_FillValue=-999
  lon#long_name=Longitude
  lon#standard_name=longitude
  lon#units=degrees_east
  lon#valid_max=180
  lon#valid_min=-180
  lon#_FillValue=-999
  NC_GLOBAL#cdm_data_type=grid
  NC_GLOBAL#Conventions=CF-1.6 ACDD-1.3
  NC_GLOBAL#creator_email=data@oceancolor.gsfc.nasa.gov
  NC_GLOBAL#creator_name=NASA/GSFC/OBPG
  NC_GLOBAL#creator_url=https://oceandata.sci.gsfc.nasa.gov
  NC_GLOBAL#data_bins=153426
  NC_GLOBAL#data_maximum=97.059814
  NC_GLOBAL#data_minimum=0
  NC_GLOBAL#date_created=2019-11-06T12:35:18.000Z
  NC_GLOBAL#easternmost_longitude=-62
  NC_GLOBAL#end_orbit_number=21910
  NC_GLOBAL#geospatial_lat_max=46
  NC_GLOBAL#geospatial_lat_min=30
  NC_GLOBAL#geospatial_lat_resolution=0.020833334
  NC_GLOBAL#geospatial_lat_units=degrees_north
  NC_GLOBAL#geospatial_lon_max=-62
  NC_GLOBAL#geospatial_lon_min=-78
  NC_GLOBAL#geospatial_lon_resolution=0.020833334
  NC_GLOBAL#geospatial_lon_units=degrees_east
  NC_GLOBAL#history=l3mapgen ifile=A2006167181000.L3b_time.nc ofile=A2006167181000.smi_chlor_a_mn.nc product=chlor_a,chlor_a:stdev resolution=2km east=-62 west=-78 south=30 north=46 quiet
  NC_GLOBAL#id=L3/A2006167181000.L3b_time.nc
  NC_GLOBAL#institution=NASA Goddard Space Flight Center, Ocean Ecology Laboratory, Ocean Biology Processing Group
  NC_GLOBAL#instrument=MODIS
  NC_GLOBAL#l2_flag_names=ATMFAIL,LAND,HILT,HISATZEN,STRAYLIGHT,CLDICE,COCCOLITH,LOWLW,CHLWARN,CHLFAIL,NAVWARN,MAXAERITER,ATMWARN,HISOLZEN,NAVFAIL,FILTER,HIGLINT
  NC_GLOBAL#latitude_step=0.020833334
  NC_GLOBAL#latitude_units=degrees_north
  NC_GLOBAL#license=https://science.nasa.gov/earth-science/earth-science-data/data-information-policy/
  NC_GLOBAL#longitude_step=0.020833334
  NC_GLOBAL#longitude_units=degrees_east
  NC_GLOBAL#map_projection=Equidistant Cylindrical
  NC_GLOBAL#measure=Mean
  NC_GLOBAL#naming_authority=gov.nasa.gsfc.sci.oceandata
  NC_GLOBAL#northernmost_latitude=46
  NC_GLOBAL#number_of_columns=768
  NC_GLOBAL#number_of_lines=768
  NC_GLOBAL#platform=Aqua
  NC_GLOBAL#processing_level=L3 Mapped
  NC_GLOBAL#processing_version=Unspecified
  NC_GLOBAL#product_name=A2006167181000.smi_chlor_a_mn.nc
  NC_GLOBAL#project=Ocean Biology Processing Group (NASA/GSFC/OBPG)
  NC_GLOBAL#publisher_email=data@oceancolor.gsfc.nasa.gov
  NC_GLOBAL#publisher_name=NASA/GSFC/OBPG
  NC_GLOBAL#publisher_url=https://oceandata.sci.gsfc.nasa.gov
  NC_GLOBAL#southernmost_latitude=30
  NC_GLOBAL#spatialResolution=2.32 km
  NC_GLOBAL#standard_name_vocabulary=CF Standard Name Table v36
  NC_GLOBAL#start_orbit_number=21910
  NC_GLOBAL#suggested_image_scaling_applied=No
  NC_GLOBAL#suggested_image_scaling_maximum=20
  NC_GLOBAL#suggested_image_scaling_minimum=0.0099999998
  NC_GLOBAL#suggested_image_scaling_type=LOG
  NC_GLOBAL#sw_point_latitude=30.010416
  NC_GLOBAL#sw_point_longitude=-77.989586
  NC_GLOBAL#temporal_range=1-hour
  NC_GLOBAL#time_coverage_end=2006-06-16T18:14:58.000Z
  NC_GLOBAL#time_coverage_start=2006-06-16T18:10:01.000Z
  NC_GLOBAL#title=MODISA Level-3 Standard Mapped Image
  NC_GLOBAL#westernmost_longitude=-78
  NC_GLOBAL#_lastModified=2019-11-06T12:35:18.000Z
Corner Coordinates:
Upper Left  ( -78.0000025,  45.9999987)
Lower Left  ( -78.0000025,  29.9999994)
Upper Right ( -61.9999975,  45.9999987)
Lower Right ( -61.9999975,  29.9999994)
Center      ( -70.0000000,  37.9999990)
Band 1 Block=257x257 Type=Float32, ColorInterp=Undefined
  NoData Value=-32767
  Unit Type: mg m^-3
  Metadata:
    display_max=20
    display_min=0.0099999998
    display_scale=log
    long_name=Chlorophyll Concentration, OCI Algorithm
    NETCDF_VARNAME=chlor_a
    reference=Hu, C., Lee Z., and Franz, B.A. (2012). Chlorophyll-a algorithms for oligotrophic oceans: A novel approach based on three-band reflectance difference, J. Geophys. Res., 117, C01011, doi:10.1029/2011JC007395.
    standard_name=mass_concentration_of_chlorophyll_in_sea_water
    units=mg m^-3
    valid_max=100
    valid_min=0.001
    _FillValue=-32767
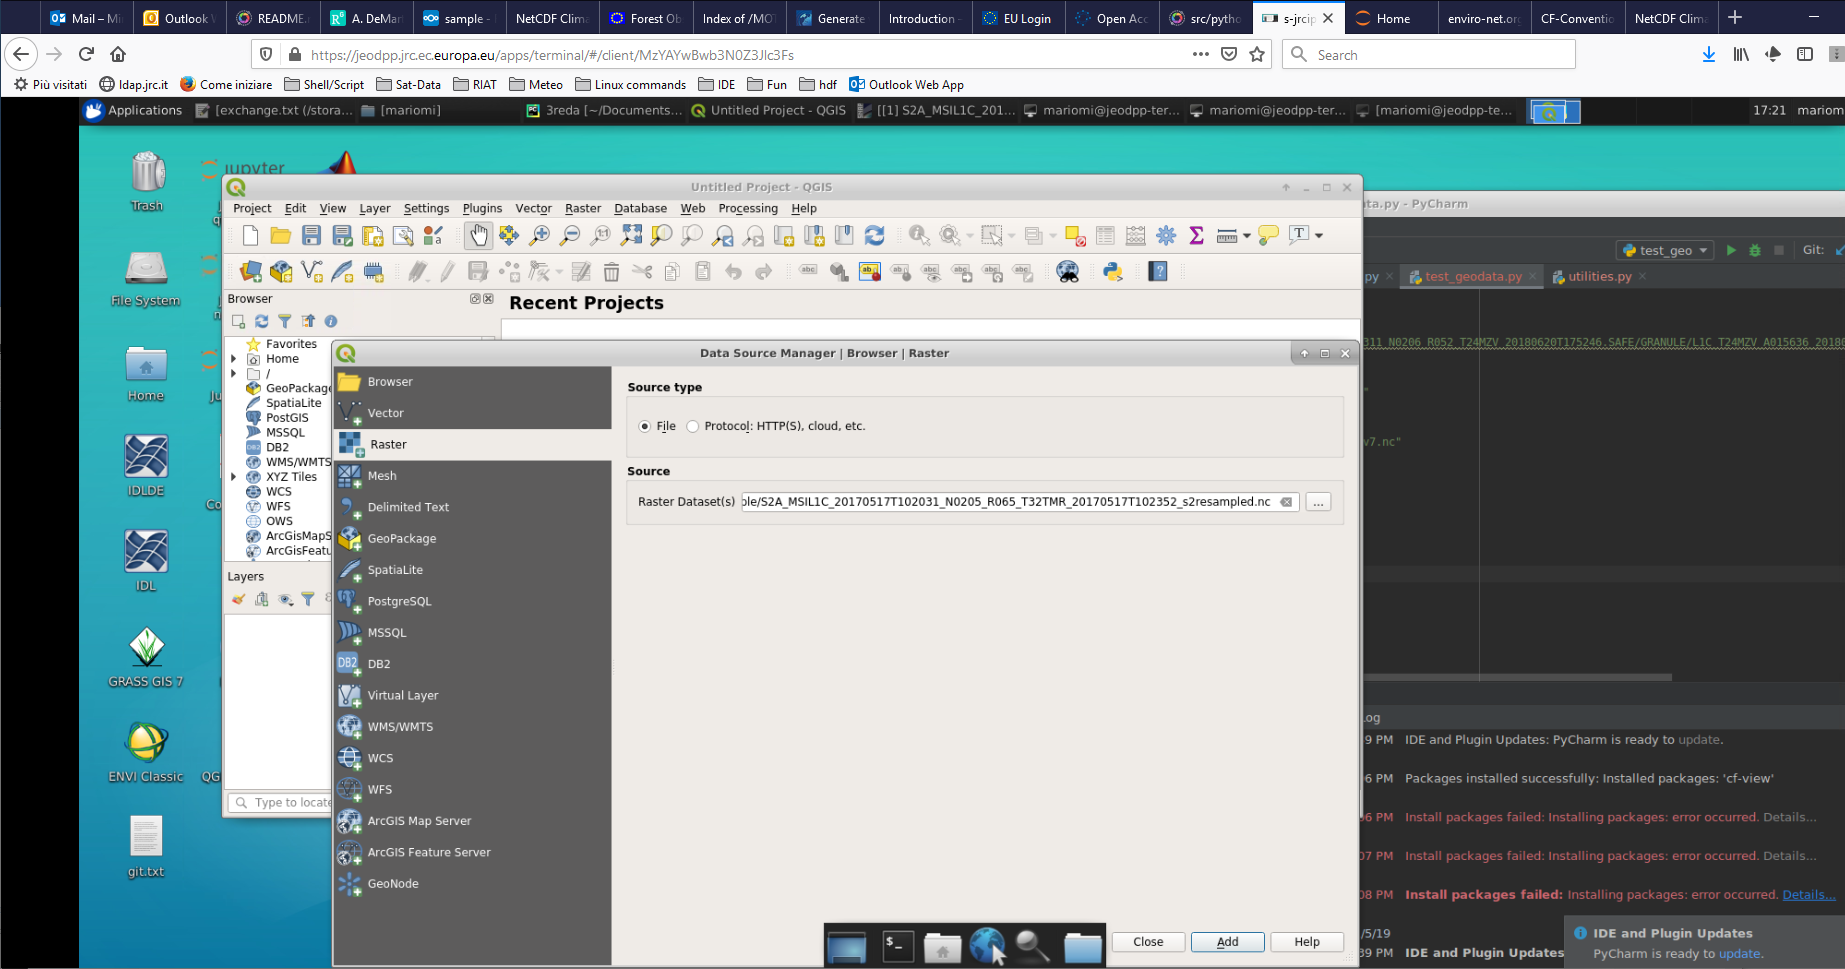
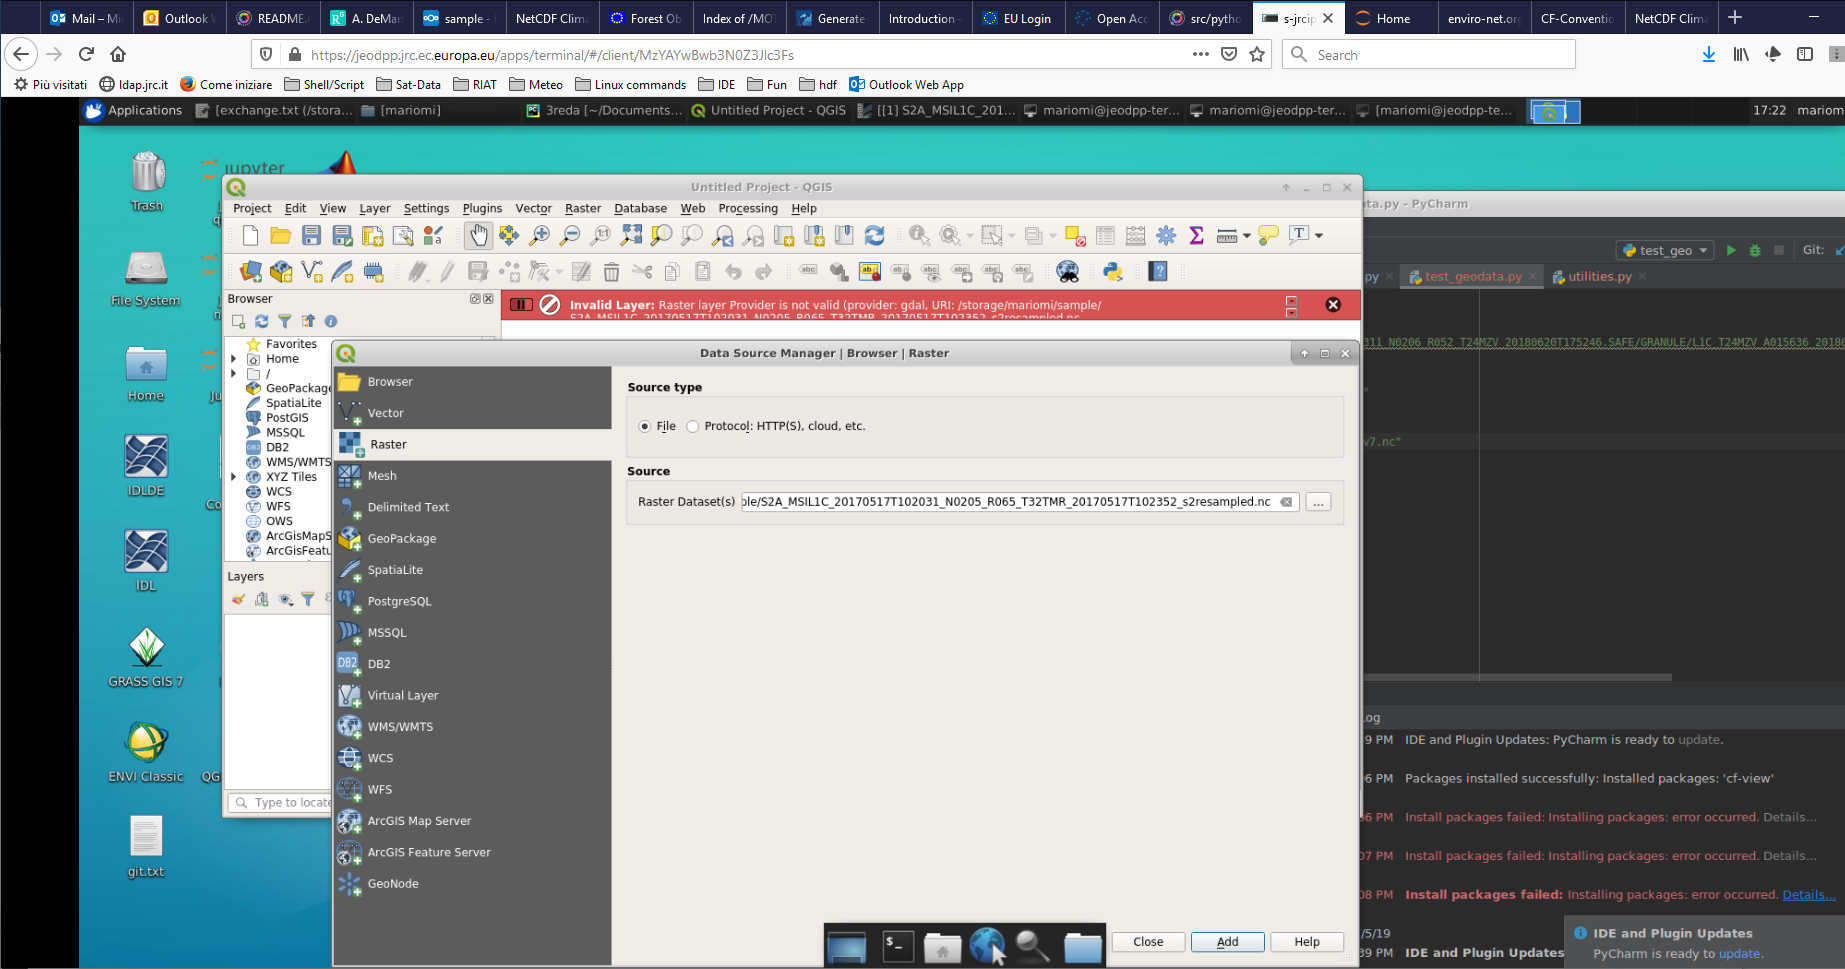
Qgis uses gdal under the hood, so should also use the subdataset names.