Hi!
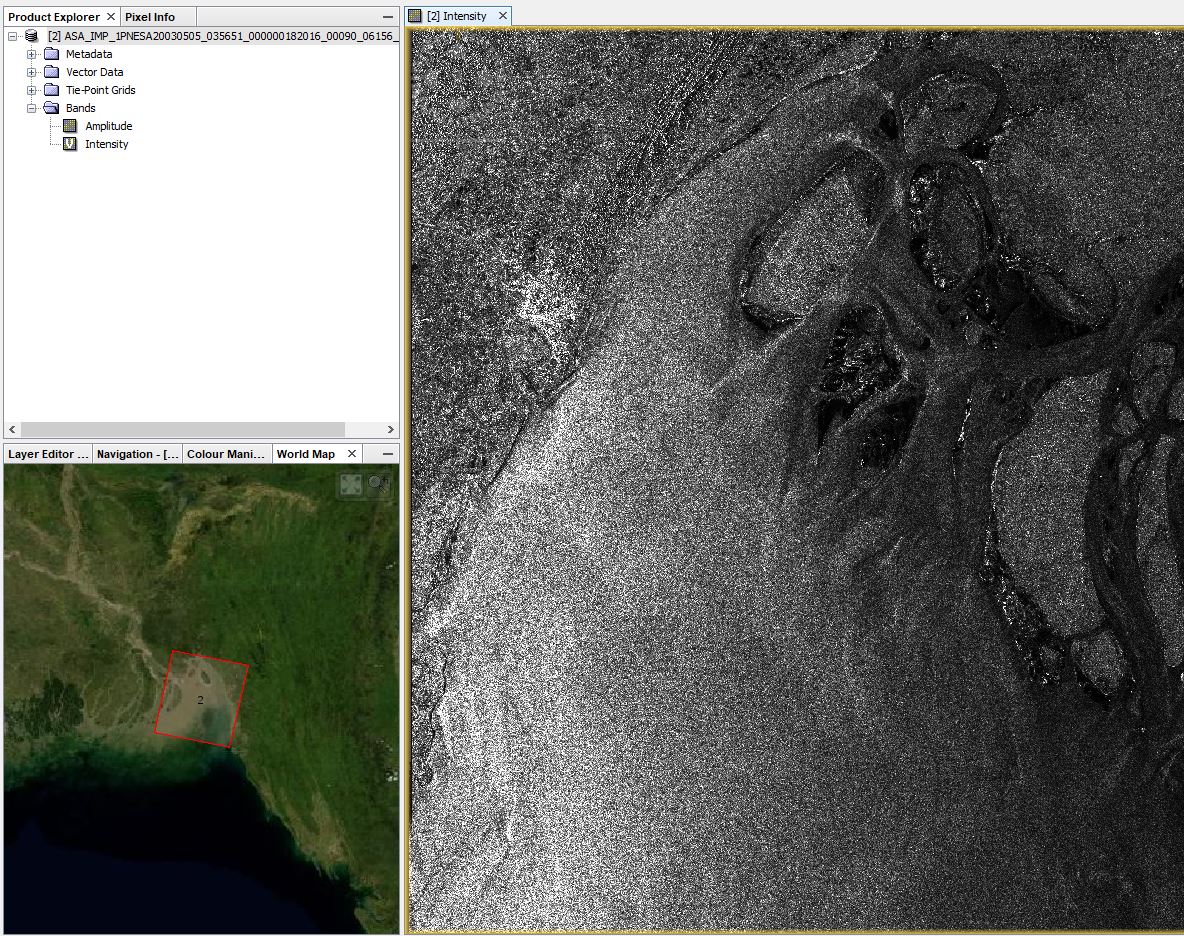
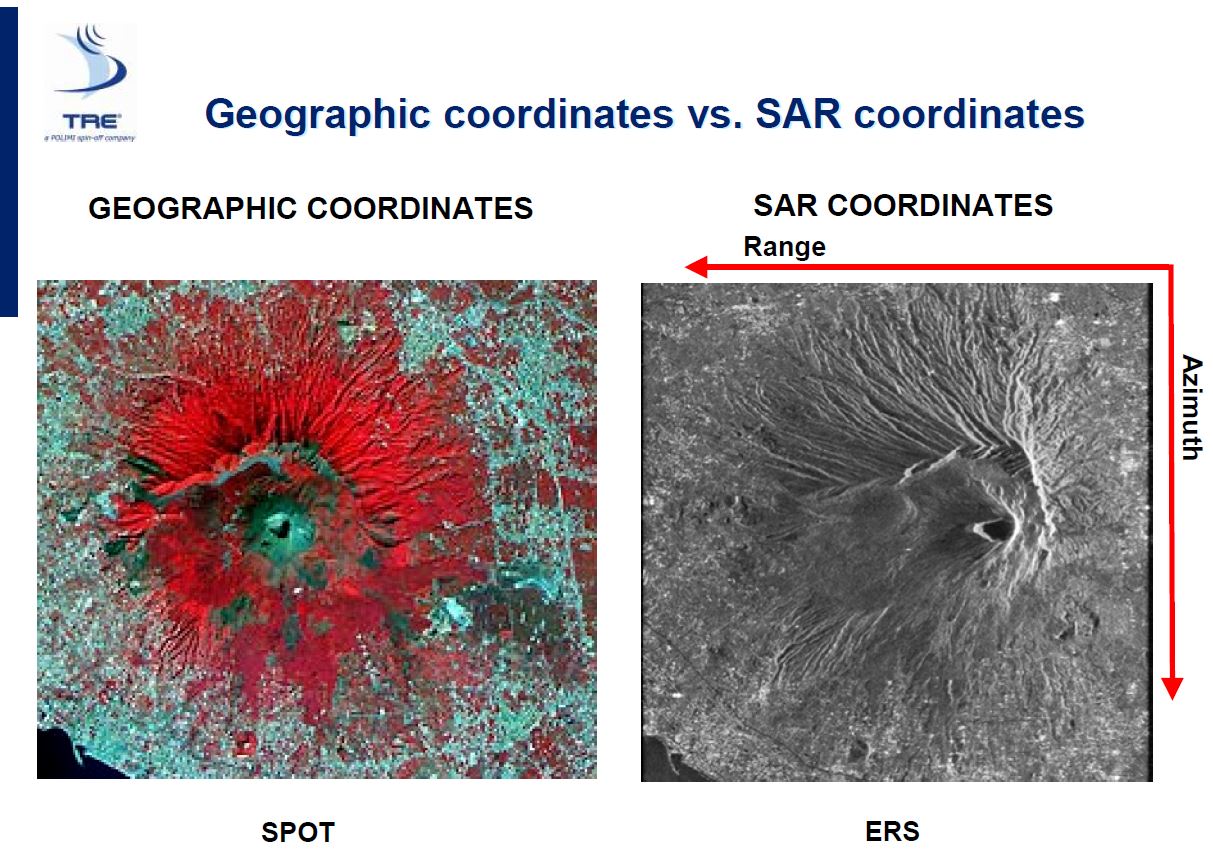
When i open a sentinel-1 data in SNAP, i can only see black and white dots. But in the image below, an ERS SAR image is like an optical image.
Is there any way to see a sentinel-1 image like below, in SNAP or another applications?
Thank you.
Hi!
When i open a sentinel-1 data in SNAP, i can only see black and white dots. But in the image below, an ERS SAR image is like an optical image.
Is there any way to see a sentinel-1 image like below, in SNAP or another applications?
Thank you.
This is a matter of visual pixel resampling. The way how a software displays pixels which are below the resolution of your screen (=one pixel of your screen contains multiple pixels of the raster) is differently handled. ERDAS Imagine, for example, has excellent resampling predefined which displays radar images super smooth. In ArcMap or QGIS, you can change the resampling in the raster properties.
SNAP displays data in Nearest Neighbor resampling, that means one pixel value of the raster is taken for the whole screen pixel. This leds to a visually noisy representatioN:
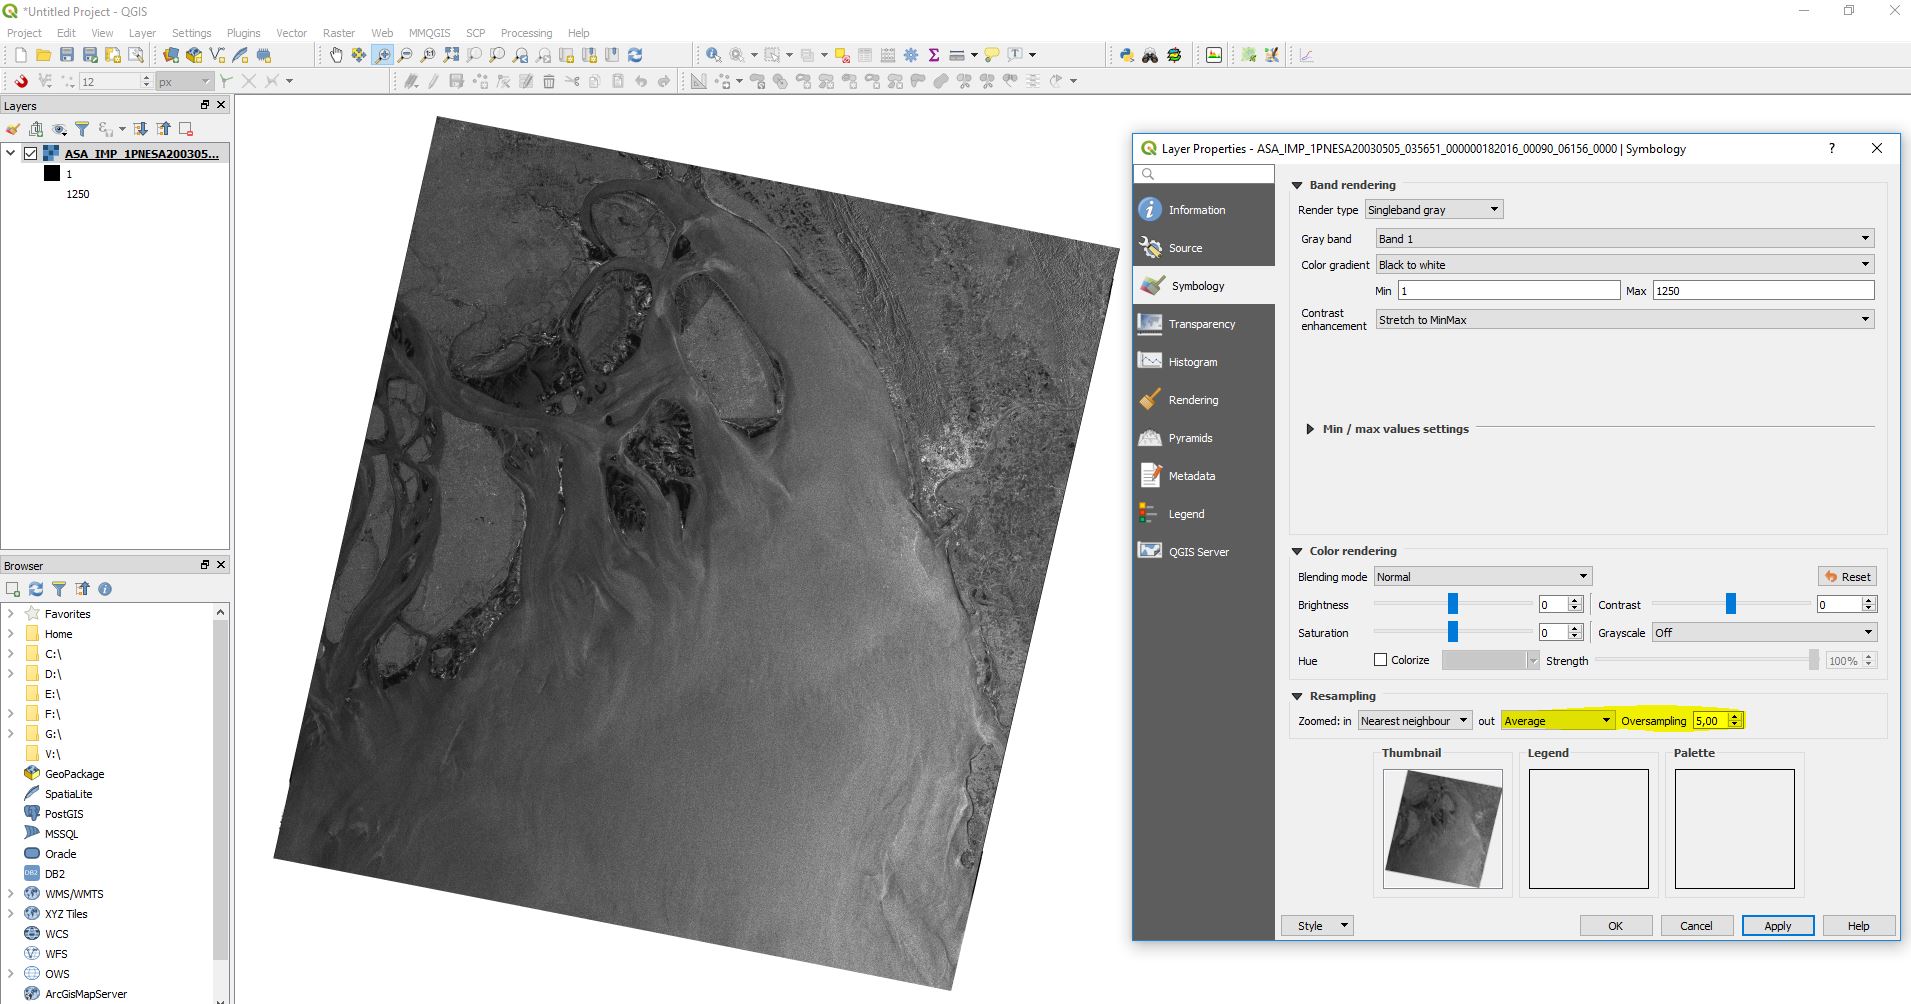
The same data in QGIS:
Nearest Neighbor resampling:
Average over 5 pixels:
Enlarge the images to see the effect of different visual resampling.
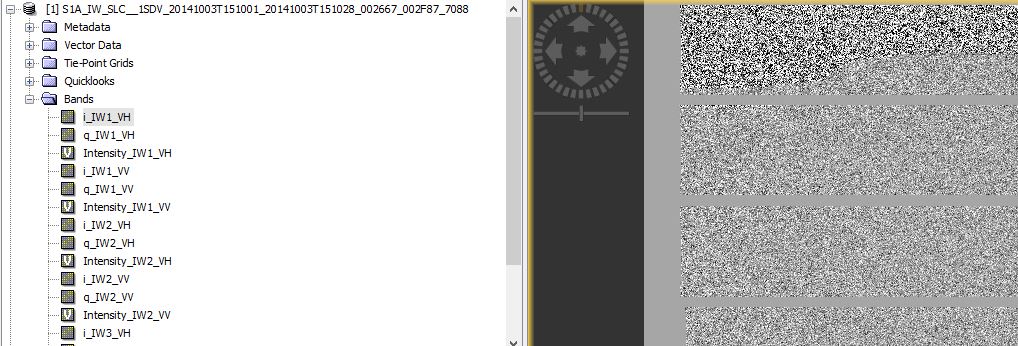
I was trying to see with SLC data and my screen was like below.
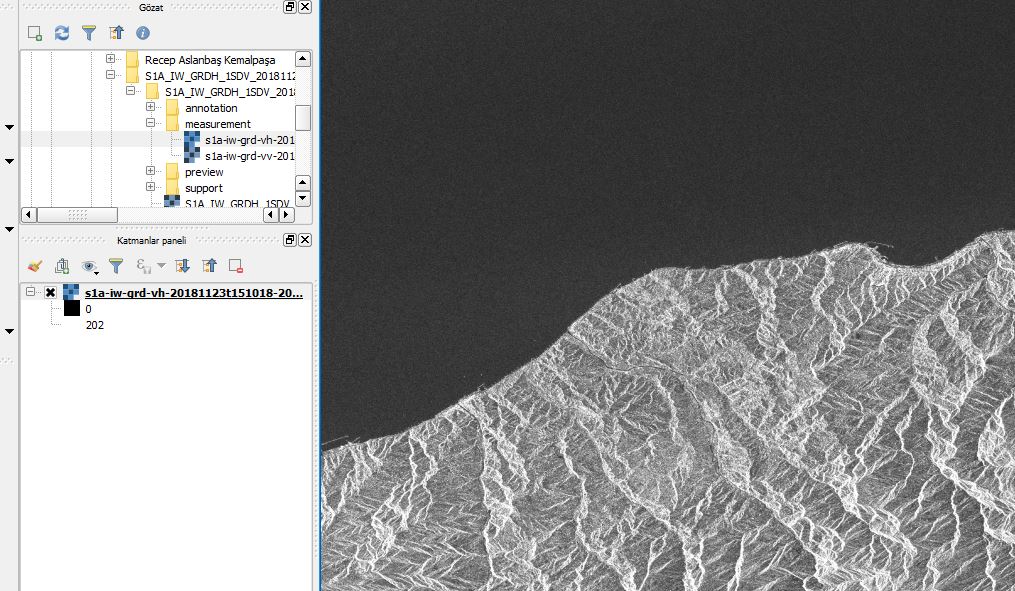
And, after your post, i decided to download a GRD image and then my screen is like i desired.
Finally, i opened the GRD image in QGIS and set the new resampling like your explained.
Thank you.
At this point, new questions occurred in my mind.
1- In the SLC data under bands folder, there are “i”, “q” and “intensy” images. What are the meaning of these, what do they do?
2- In the GRD data under bands folder, there are “Amplitude” and “Intensity” images. What are the meaning of these, what they do?
3- For visualating the SLC data like GRD data, what steps should I apply?
Thank you.
i and q are the real and imaginary parts of the complex sar information (amplitude+phase).
Regarding question 1 and 2: I suggest reading some basic literature on SAR: http://www2.geog.ucl.ac.uk/~mdisney/teaching/PPRS/PPRS_7/esa_sar_tutorial.pdf
The processing of SLC and GRD products is suggested here: Radiometric & Geometric Correction Workflow - #35 by ABraun
Just to avoid any confusion, yes i and q are the real and imaginary comples values which can be used to calculate amplitude and phase thus (i) amplitude = sqrt (i * i + q * q) and (ii) phase = arctan(q/i). Intensity is the square of amplitude.
The best way to display sub-sampled SAR detected (GRD) images (i.e. not a full resolution) is to use RMS block averaging. So for example if a sub-sampling by a factor of 3 is required, the square the values of the 9 pixels, take the average and then take the square root. This means that all the data is used to generate the sub-sampled image and not every third pixel in range and every third pixel in azimuth. Unfortunately SNAP does not use this RMS technique to display the full scene and so it does not looks very good.