Hello everyone,
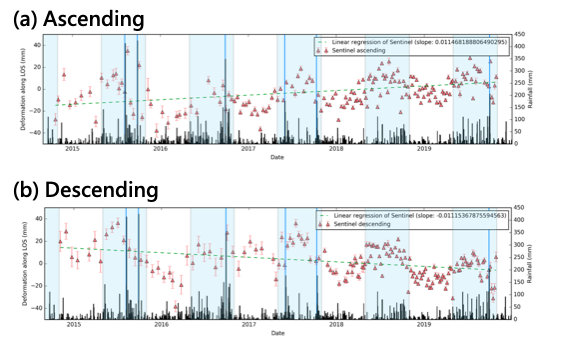
I have used 177 ascending images and 160 descending images to monitoring a creeping landslide area. It is a dip slope toward to the southwest direction.
The long term trends of time series derived from ascending and descending images are reasonable.
The slope of the time series derived from the ascending images is positive means the displacement was closed to the satellite along the LOS direction. While the slope of the time series derived from descending images is negative means the displacement was away from the satellite along the LOS direction.
But the seasonal fluctuations of the time series are strange. I supposed the seasonal fluctuations of time series derived from ascending and descending images would be opposite. But the fluctuations are in the same trend whether it was derived form ascending or descending images.
I don’t know how to explain it or is there anything I misunderstand?
Please give me some hints or suggestions to deal with this problem. Thank you very munch!