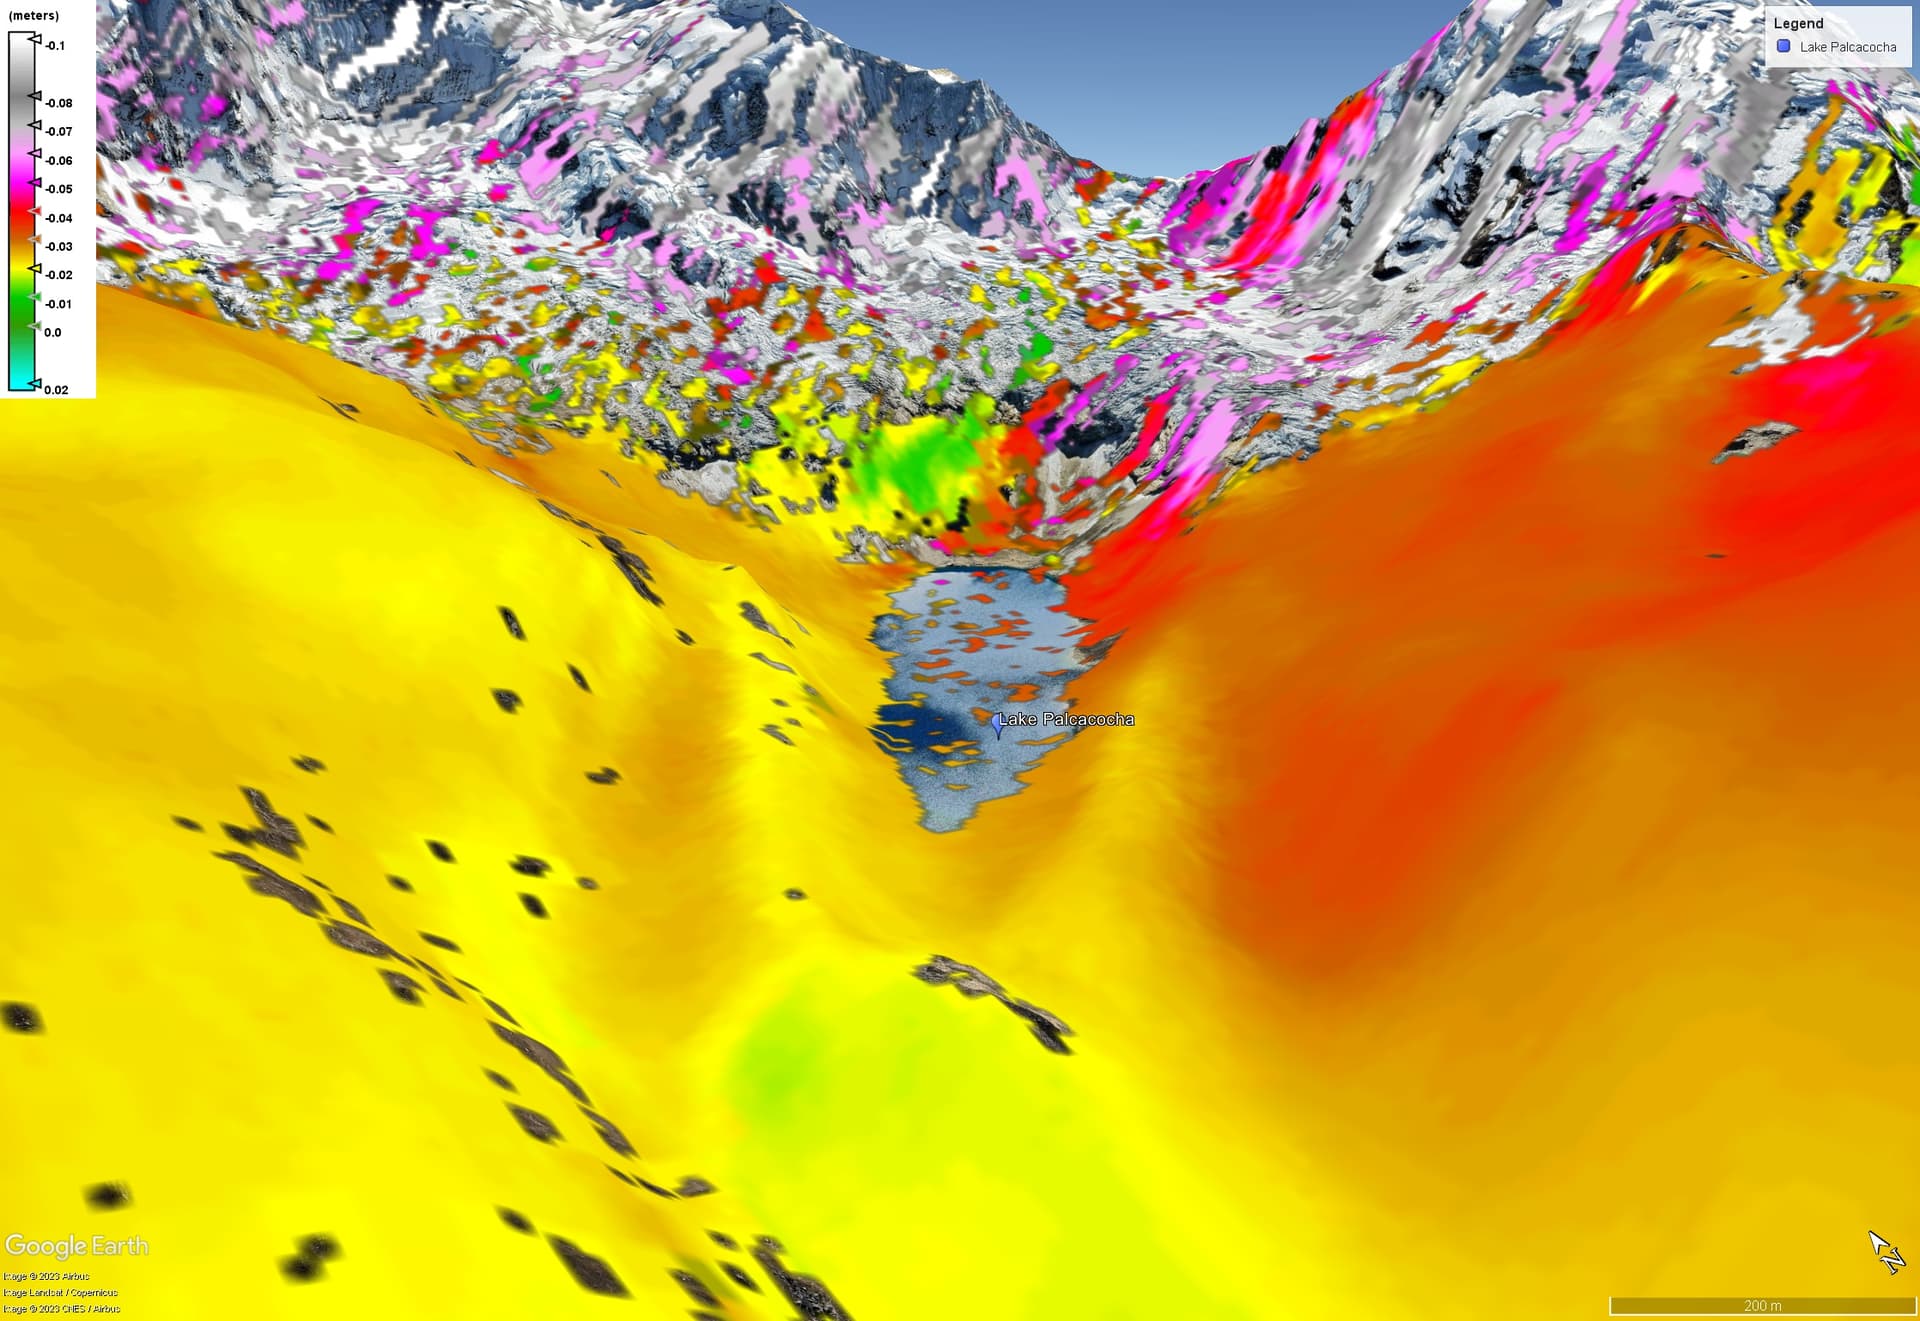
I have been using SNAP to create deformation maps for Lake Palcacocha and surrounding areas in the Andes Mountains in Peru in order to determine the stability of the ground and moraine dam surrounding the lake. Some of the displacement maps created show that the entire study area is subsiding by up to 6cm in a 12 day period which cant be correct.
Other maps that I have created also show large patches of uplift between 1-4cm in a 12 day period. Has anyone else ever come across this or could anyone offer an explanation for this?