My question is How can select the export point, because this only show me 14 points. Before that i run ps_plot(‘v-do’, ‘ts’) and select random points in the graph.
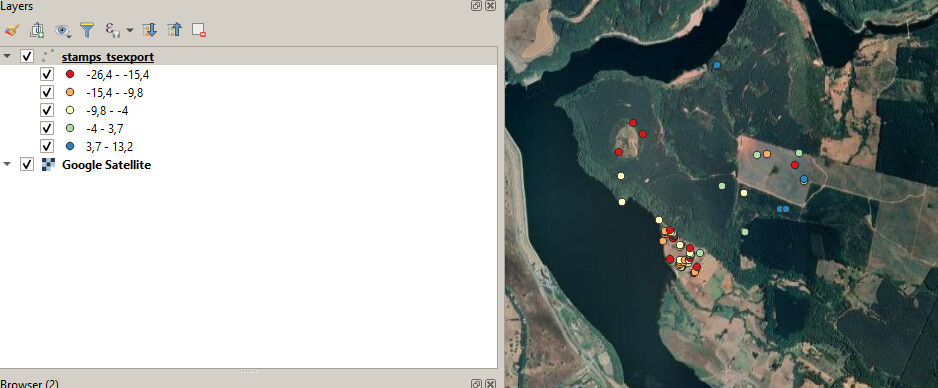
You define the radius around your selected point in the matlab window. 100 m is set by default, if you want more points exported you have to increase the radius and select an area with high ps density
You should consider using more images to get a denser set of points with more reliable predictions. Your points look rather random. Or did you just share a subset of your points?
But somebody call me and ask if can set an analisys in a hill (3 points red togheter in the image). But in hills with trees cant reflect well. But for practice and test are good. I set 20 images and after 24 and compare the result. In 24 images i have less points (or less noise i think, 3 points red disapears). I try to change the parameters for landslide tested by [Höser 2018]:
But matlab give me and error related with error using /matrix dimensions. In the forum says maybe change for a bigger area (i set a perimeter 46km and an area of 126km2). So only can run with the default parameters. Wherever, noting of these can be possible with you support. Here are the ps for 24 and 20 images, feel free to check!. Thanks a lot
Yes, in rural areas, more images can lead to less identified ps, but in the end their information is more reliable.
Good job on integrating the values reported by Thorsten Höser!
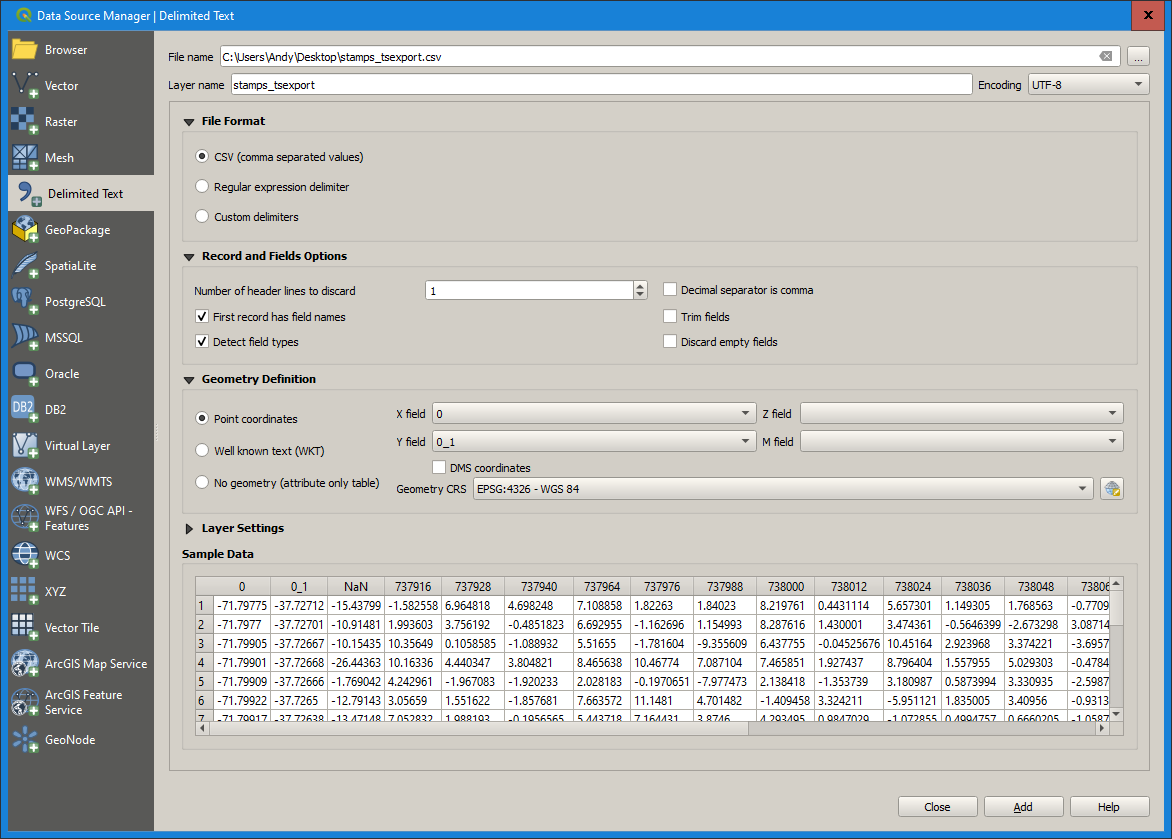
Hello, I have a trouble with the .csv file that I have exported through STAMPS.
All data are detected in one column and i cannot proceed with the visualizer. Can you please help me?
I attach the .csv file to see what I am saying. stamps_tsexport_f.csv (1.6 MB)