Hi all,
sen2cor in its newest version 2.9 but also 2.8 overcolors images to yellowish color. See images below
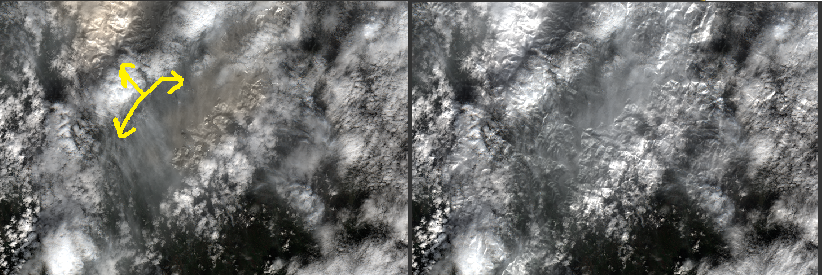
it is an image from 2017/04/18 and polygon T33UYP, left L12A image processed by sen2cor 2.9 and right the same polygon as originally processed by ESA. Red, green and also blue bands are increased in comparison to ESA L2A. Suppose this overcoloring should not happen. The settings in L2A_CAL_AC_GIPP.xml seems to not have an effect on this for 2.9 and 2.8.
just to go sure: Did you apply the same visual color stretching to both views?
In the SNAP I left the values of color sliders default, no changes were made be me. It is as the SNAP displayed it directly from the “Open RGB image window”. I suppose, it calculated the sliders automatically based on the real max and min values. And these values of min and max are different for the two cases.
Also the pixel values are different for these two images. So it is not visual stretching what is causing this yellowish coloring, but actual modification of the RGB bands on the pixel values. Anybody can replicate this by using sen2cor 2.8 or 2.9 on the T33UYP polygon.
No such coloring was present when I did conversion to L2A with sen2cor versions 2.05.05 and lesser
Also, this is not the only case of this yellowish coloring for 2.8 and 2.9 versions. I suppose, this coloring is happening in more general case for these two new versions of sen2cor. But this case is the most obvious one as the coloring is best visible on the white background, the clouds.
I would really be glad, if ESA could publish their full settings for T33UYP given date 2017/04/18 as they were set in their configuration files L2A_CAL_AC_GIPP.xml, L2A_CAL_SC_GIPP.xml and also L2A_GIPP.xml. Just to be able to fully match their conversions.
I suppose, that even slight incompatibility in settings and even different versions of sen2cor (caused by mainly many fixes and modifications/improvements) could cause misrepresentation and misinterpretation of the agricultural trends and development. What else is yellowish colored? This can affect the NDVI index. Is that coloring correct and expected? And why is that happening?
I only want this because I am examining the T33UYP polygon and timescale from 2017/01/05 to 2017/08/03 for the one crop type and many fields. I want to keep the NDVI as much natural as possible, keeping the artificial modifications minimal and also stable for the whole period.
How large is the difference?
ESA L2A, red max: 2.029, green max: 2.139, blue max: 2.258
L2A sen2cor 2.9: red max: 1.741, green max: 1.796, blue max: 1.895
the value of the pixel at x,y (6555,373)
ESA L2A, virtual red: 1.35460, virtual green: 1.39430, virtual blue: 1.51610
L2A sen2cor 2.9: virtual red: 1.10960, virtual green: 1.06320, virtual blue: 1.03680
I suppose this difference is very significant, strong modifications were done to new versions of sen2cor since version 2.5.5. But I do not read of any particular from the software release notes, supplied with 2.8 nor 2.9, which could have caused such results. I really wonder. Whether this is an expected behavior, but where it is documented? That the blue band is lowered? Previously, there was a setting of scaling limiter and scaling disabler in the L2A_CAL_AC_GIPP.XML file.
But since 2.8 these settings seems to not have any effect at all:
<Scaling_Limiter>true</Scaling_Limiter>
<Scaling_Disabler>false</Scaling_Disabler>
despite the setting, there is no difference in the resulting image. But in the previous versions (<=2.5.5) this setting caused alteration in the bands, which were really observable even in the standard sliders setting in the SNAP.
Also speaking of this yellowish effect, no other settings in this manifest file seem to be of any effect. I wonder if they are still used. Perhaps this is just one of several anomalies of L2A production, but then, why this anomaly is not present in the L2A image originally produced by ESA?
Perhaps this has something to do with Halo anomaly id 66 described in the Level 2A Data Quality Report 02/08/2021 (issue 40).According to the report, this can occur along the image boundaries. And this could fulfill my case of T33UYP halo, which is present near the boundaries. It is an L2A anomaly, therefore it should occur in the conversion process from L1C to L2A images. This anomaly has, however, been fixed with the processing baseline PB 03.00. What are the settings for PB 03.00? And even, it is possible, that PB 03.00 is defacto a new version of sen2cor, not publicly freely available, but instead kept “in house” (for ESA L2A conversions) or is it sold commercially? The newest version of sen2cor is 2.9 and according to that
http://step.esa.int/main/snap-supported-plugins/sen2cor/sen2cor-v2-9/
it should have Halo effect fixed. But then how is it possible that it still occurs in my L2A image? I used sen2cor 2.9. I am confused.
1 Like