I have successfully processed an L1C dataset using the sen2cor cmd line. The L2A_Process was run with the --sc_only parameter since I am mostly interested in scene classification. I opened the resulting dataset in SNAP and was wondering how to visualize the scene classification? i.e. how do you arrive at the visualization shown in the attached?
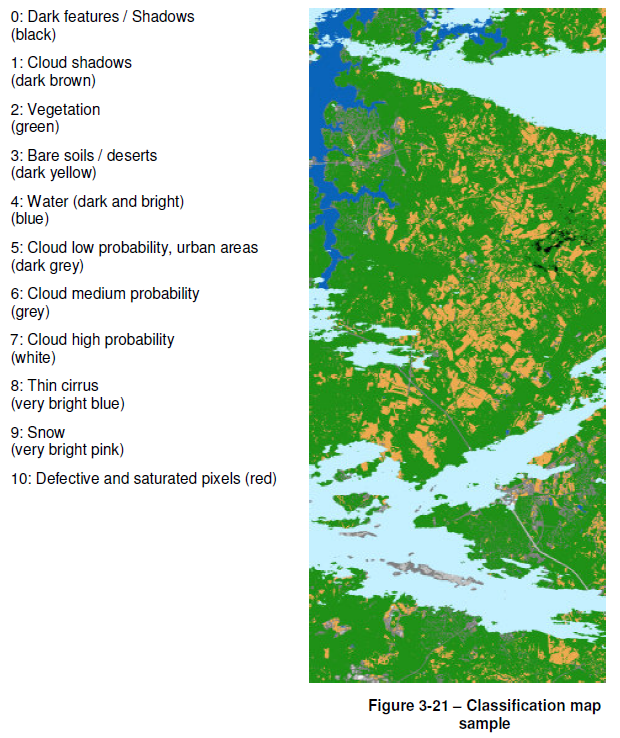
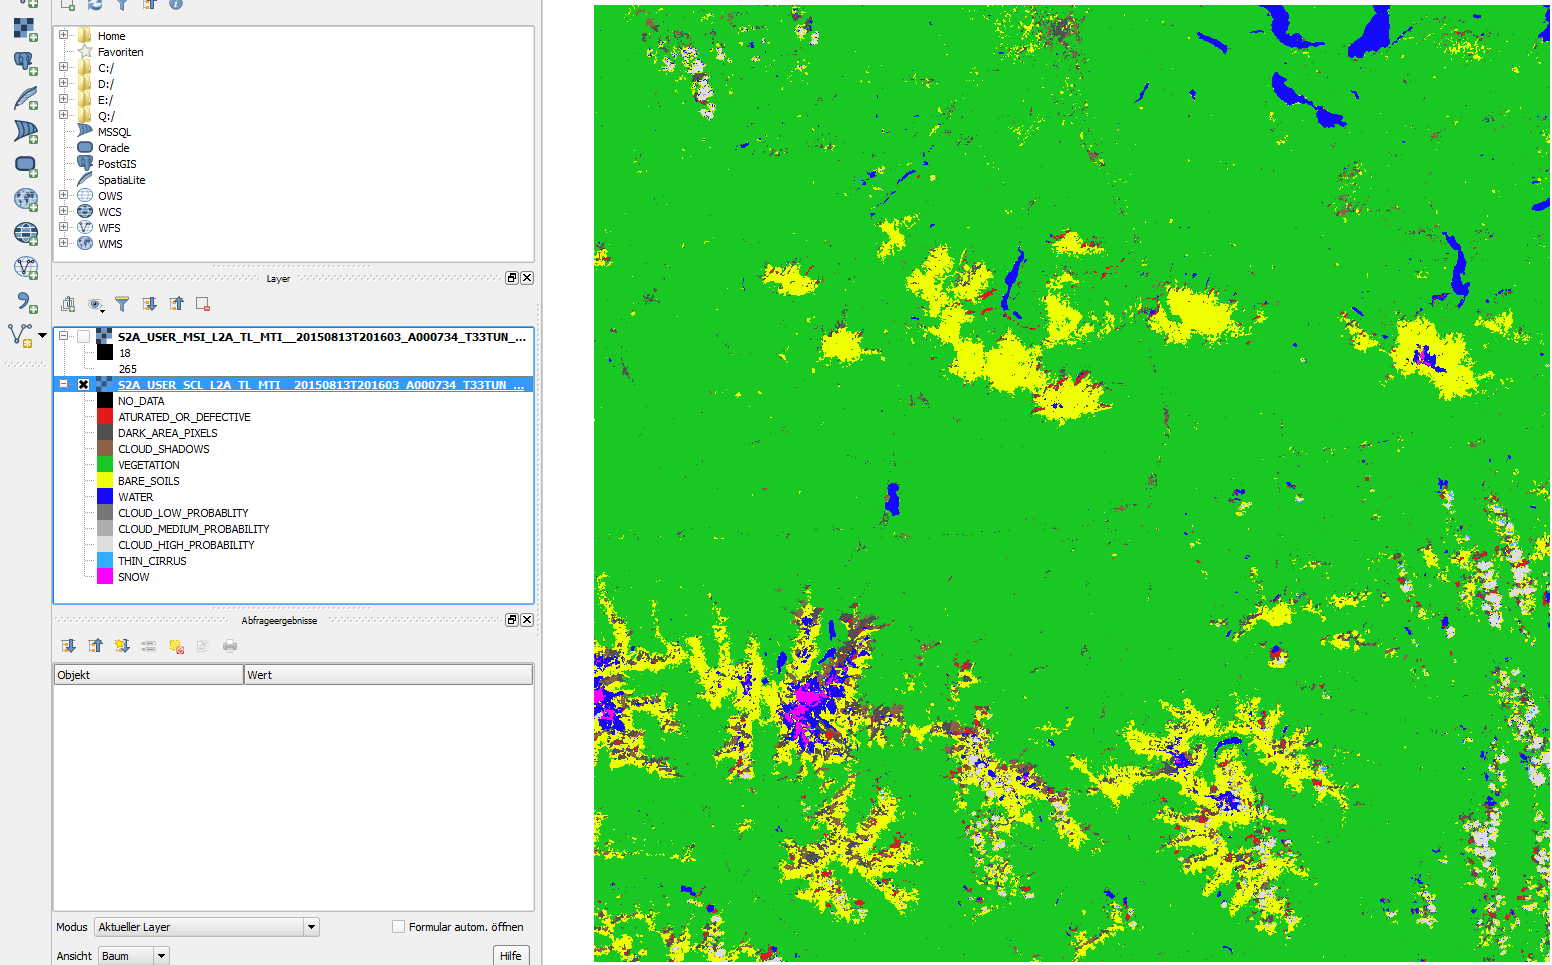
The classification result is stored as jpg2000 data in the folder …S2A_USER_PRD_MSIL2A_PDMC_20150818T101516_R022\GRANULE\S2A_USER_MSI_L2A_TL_MTI__20150813T201603_A000734_T33TUN_N01.03\IMG_DATA… .jp2. It is not georeferenced, but you can visualize it in GIS tools (QGis, …) like shown below.
It is actually possible to do something similar in SNAP, you can open the jp2 file and use the Colour Manipulation panel to choose the value/colour mapping.
You find the scene classification for the full S2-product in the SNAP product Explorer in Bands/quality/quality_scene_classification. This product is full georeferenced.
I can send you a color table assigning the colors as defined in the Sen2Cor-ATBD to the different classes. You have to load this colortable manually within SNAP 2.0, but this is much easier and faster than assigning each color individually. I understand the answer of jmalik in the way, that this color table will be loaded automatically when opening a scene classification product within SNAP 2.0.2. This would be indeed the best solution.
In case it was not clear in my previous message, the 2.0.2 update is already available.
You just need to update SNAP (Tools->Plugins and Check for available updates) to install the latest 2.0.2 Sentinel-2 Toolbox and get the correct colors in the level 2A products.
I was trying to see this classification file using QGIS. I found the way by inserting the image as raster and then going to the image properties and then selecting “Singleband pseudocolor” as render type. Then I created the classification classes as specified in the sen2cor docs (attached document) and hit apply. ClassificationClasses.txt (433 Bytes)