I am student of National Technical University of Ukraine.
I am writing this post in connection with the problem. At the moment I am working on a bachelor’s degree project.
My subject is getting NDVI from different sattelites like landsat-8, sentinel-2, also I’m trying to get linear regression between dB from VV+VH polarisation an NDVI from landsat-8…
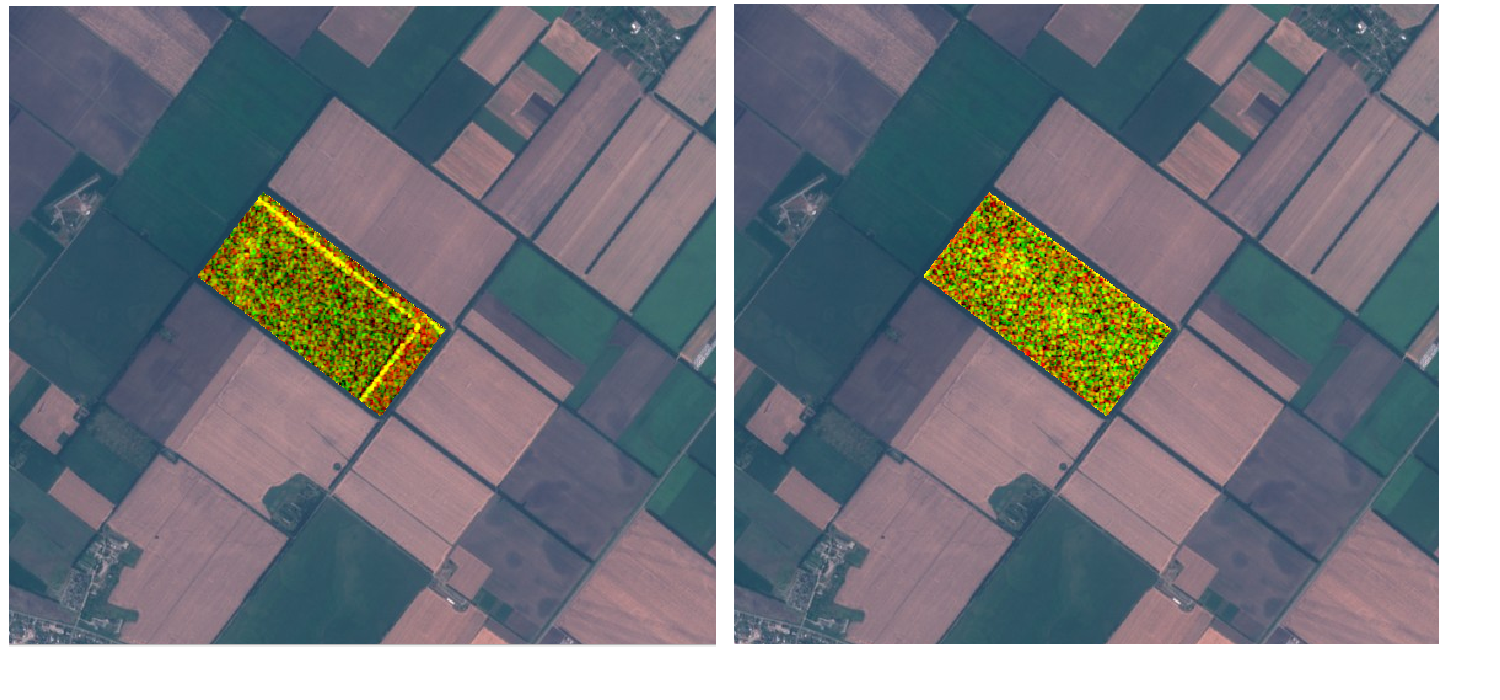
But I have some problem with sentinel-1 images. I worked only with GRDH IW products in sentinel-1 toolbox (SNAP). As you can see left image have wrong geoposition. But on this two picrutes are same fields on image but different date. And it’s not only one wrong image. It’s regularity problem.
Name of this 2 product is S1A_IW_GRDH_1SDV_20160505T033145_20160505T033210_011118_010C20_689C.zip (with wrong coordinates) and S1A_IW_GRDH_1SDV_20160506T151912_20160506T151937_011140_010CD8_BFBA.zip. I really hope that there is some solution for this issue.
What have you done to correct the positions? Have you applied precise orbits and terrain corrected? Only after terrain correction can you assume a geocoded image in map coordinates.
If you check these images in Google Earth Engine (which contains geocoded S1 IW GRD sigma_0), there is no issue with misregistration. It’s a DESC/ASC combination, so geocoding is definitely required.
In case you are a Google Earth Engine user, try this script:
var s1 = ee.ImageCollection(‘COPERNICUS/S1_GRD’).filterMetadata(‘instrumentMode’, ‘equals’, ‘IW’).
filter(ee.Filter.eq(‘transmitterReceiverPolarisation’, ‘VV’)).select([‘VV’]);
var s1p1 = s1.filterDate(‘2016-05-05’, ‘2016-05-07’).filter(ee.Filter.stringStartsWith(‘system:index’, ‘S1A_IW_GRDH_1SDV_20160505T033145_20160505T033210_011118_010C20_689C’));
print (s1p1);
var s1p2 = s1.filterDate(‘2016-05-06’, ‘2016-05-07’).filter(ee.Filter.stringStartsWith(‘system:index’, ‘S1A_IW_GRDH_1SDV_20160506T151912_20160506T151937_011140_010CD8_BFBA’));
print(s1p2);
Map.addLayer(s1p1, {min: -20, max: 0}, ‘May 5’)
Map.addLayer(s1p2, {min: -20, max: 0}, ‘May 6’)
Map.addLayer(ee.Image(-20).addBands(s1p1.first()).addBands(s1p2.first()), {min: -20, max: 0}, ‘May 5 & 6’)
Thank’s for solution. I have tried to get image after Elipsoid Correction RD.
Now my graph look like this:

Unless you are outside SRTM there’s really no reason to use Ellipsoid Correction only IMO.