I’m doing DEM generation process using sentinel-1 images in SNAP. There are a lot of concepts in this way that I don’t familiar with them like phase and coherency images and etc. So how can I get some useful information about these topics?
A separate tutorial on DEM generation with S1 is planned. But please be aware that you need several conditions for a good DEM
the perpendicular baseline is ideally above 150 meters
two images at short intervals
no rain during the acquisitions, at best images from the dry season
no vegetation cover
Sentinel-1 is mainly designed for differential interferometry and not for DEM generation. Most of the approaches fail because the requirements above are not given and the phase is decorrelated.
Dear Braun
Thanks for your support.
How can I produce DSM (Digital Surface Model) using sentinel-1 imagery? Could you guide me please? what’s the differences there are between DEM and DSM process in SNAP?
again, please check this tutorial - it is the best start for your your case.
Any interferometric analysis refers to the surface of objects, because c band does not penetrate very much. But it is not very reliable at this spatial resolution.
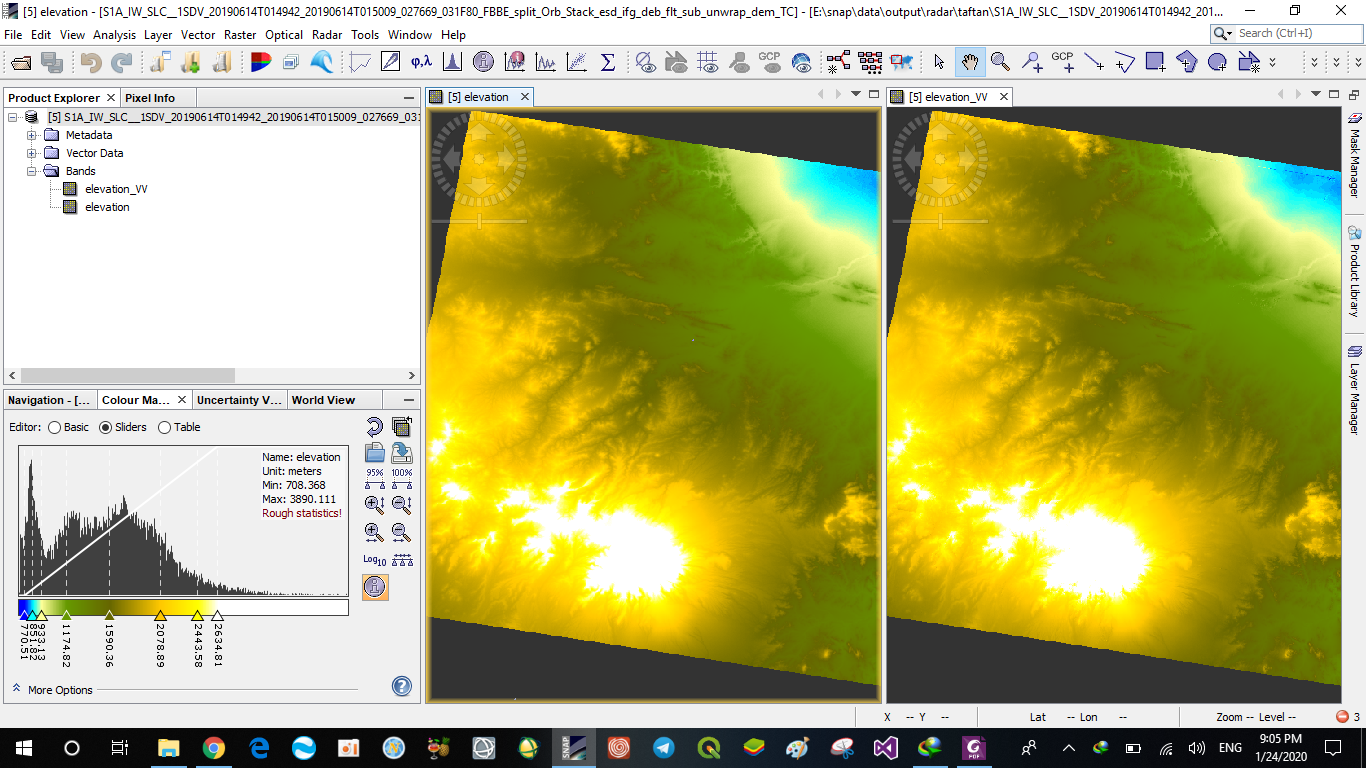
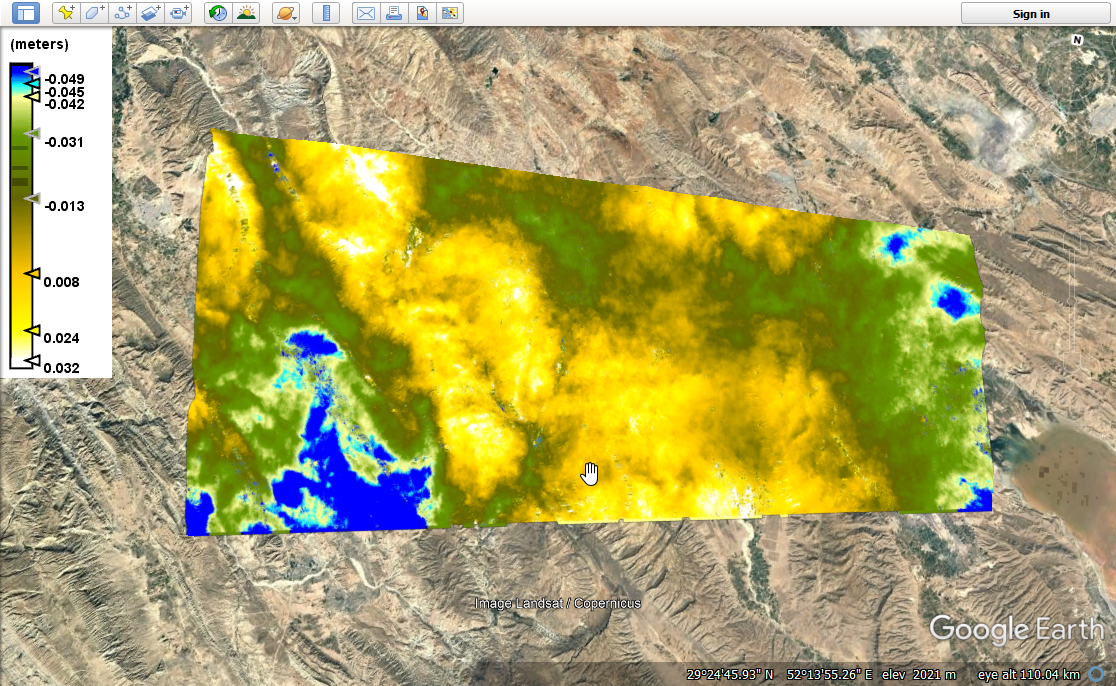
The new tutorial that you mentioned works as best as possible. I’ve created a new sentinel-1 DEM and comapred with SRTM 1arc-sec. Comparison has shown in below, have a look please! It is very similar to SRTM DEM quantitatively and qualitatively.
Of course I followed all the conditions stated in the new tutorial that you introduced.
Thanks to your guides in my project DEM generation process works well, however DSM generation cause qualitative error. When I used phase to height command in SNAP, some areas shows with distorted values like negative elevations. Do you have any suggestion for DSM process? I’ve analysed existing instructions in articles but it doesn’t work properly.
I’m glad you find it useful.
About DEM vs DSM: InSAR does not really make a difference here. It depends on the wavelength of the sensor which target (or which part of a surface) reflects the most. You cannot get different surface levels from traditional InSAR.
There are many considerations (like baseline and etc.) for data selection in DEM generation process to make a suitable coherence together. So I’m gonna to know that should I follow this instructions for input data in displacement process (like land subsidence) or not?
I’ve calculated displacement using sentinel-1 data in a study area where no earthquake, landslides or etc. happened recently. However the exported map indicates a few millimeters uplifting and down lifting. Does this amount of changes usually happen naturally or not, this is invalid result? Could you guide me please?
As input data, I’ve selected tandem acquisition images (36 days interval) and these changes shows the amount of displacement that occurred during this time?
Yes. In interferogram formation step I’ve selected subtract topographic phase, and I’ve done this process according to newest manual that is published by ESA.