my overall goal is to create radar time series of a forest Area of Interest from Sentinel-1 within the SNAP GUI.
I would need a “how-to” which I didn´t find yet.
My main problem at the Moment is that I don´t succeed in combining all my products from one orbit to a time-series. I tried to stack all products, but the stack doesn´t align.
Who knows what could be the reason?
Maybe I made a mistake before (see the steps I have taken so far below).
Is it possible to create a time-series visualization from multiple Products (I have 40-80 products per orbit)?
Thank you for your suggestions,
Cheers,
Konrad
PS:
Here are the steps I have done so far:
I have downloaded a year of S1-Data over my AOI.
I have split the data according to their relative orbits ( I want to handle one orbit first to keep it simple).
I have batch processed them with a graph as follows:
Even if you have products of the same track (relative orbit), which absolutely makes sense, there can be smaller shifts within the images. If you have GRD data, you can use the coregistration module to create a proper stack. I would recommend this pre-processing
Apply Orbit
Subset
Calibrate
Then you coregister these products and terrain correct the coregistered stack as a last step.
Thank you for the hint. With checking the coregistration box I get an aligned stack.
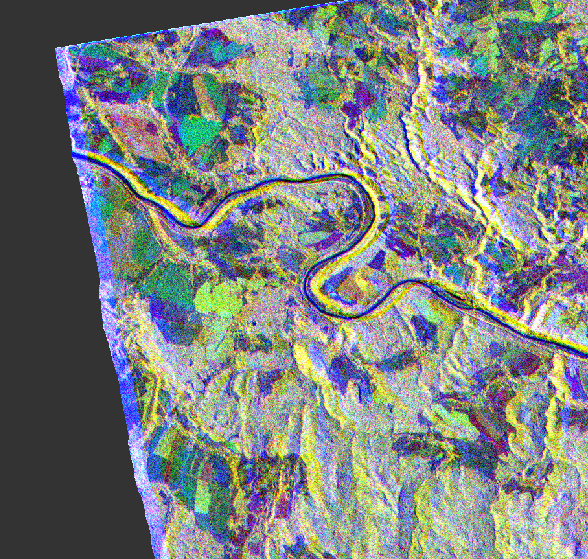
In the Image below you can see VH Polarisation from three different dates. Some images where even shifted so that you would see the river twice.
Unfortunately I discovered, that I cannot load the stack in the Time-series tool, but have to use the single Images again. Is that correct or did I oversee a possibility?
My Area of Interest is at least partly covered by different orbits. How would you suggest to use data from different orbits?
In other preprocessing workflows I have seen Terrain-Flattening. However I failed to combine it with Terrain-Correction. Is it possible or meaningful to combine these?
Yes, the time series tool needs single images as inputs. A tutorial is currently in preparation.
Coregistration should fix the shifts, but only for images of the same track. Terrain correct all stacks first. Then you can try to coregister the stacks of different tracks using “product geolocation” as initial offset method (second tab).
The image above doesn’t look too bad to me. Is it composed of different tracks? Looks like the blue patterns along the river result from viewing angle differences.