I have been developing a processor for Sentinel-1 IW mode. I adapted the decoder from s1isp_decoder to work with the processor from SM_processor. Then, I added specific processing techniques for TOPSAR processing, including unfolding and resampling in azimuth.
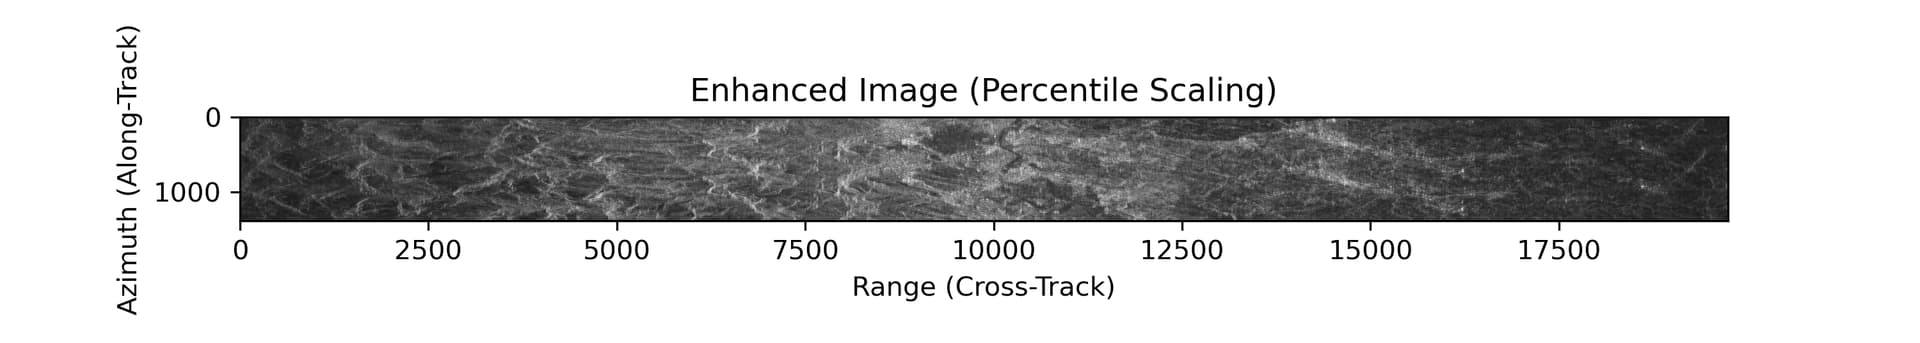
After processing a burst, the resulting image shows an amplitude modulation along the range dimension, appearing brighter in the middle and darker at the edges.
I have not applied the Elevation Antenna Pattern (EAP) correction described in Section 9.5 of the Sentinel-1 Detailed Algorithm Definition document. Could this be the cause of the amplitude variation I’m observing?
If so, the EAP is provided as a LUT in the AUX_CAL product. However, I haven’t been able to find this product for download on the Copernicus browser. Is the AUX_CAL product publicly available, and if so, where can it be accessed?
Perfecting this is quite altruistic process. The IPF processor (code) is protected by the developer and ESA cannot help much. The datasets and procedures (how, what, why) is pretty much ad hoc knowledge developed through “generations” by now (including ERS and ENVISAT).
Actually there are 3 aux products declared by the IPF processor:
SAR Level-0 calibration products (AUX_CAL)
SAR Level-0 noise products
SAR Level-0 annotation products.
Thus far I have not seen consistent access to those datasets. Also there are some RAW/L0 datasets missing on CDSE.
I was wondering which was the source of the extra extent I was getting in the azimuth direction. First, I selected a smaller sweeping bandwidth (I was using the maximum sweeping bandwidth defined in ESA Detailed Algorithm document) which actually reduced the azimuth extent, but some aliasing was introduced.
Then I refined the resampling step, both in the frequency unfolding and resampling and in the time unfolding and resampling, to downsample for a non-integer factor and exactly adapt to the bandwidth after low pass filtering. And here the problems started. By the way, the downsampling is done using a quadratic interpolation.
If during the mosaicking in frequency and time I use one replica less than the number of replicas obtained following ESA Detailed Algorithm document, I get a focused image, if not I get the following:
Which can be the reason? I am getting an unfocused image or an aliased image?
This is a list with the values of the main parameters considered in the TOPSAR Processing. I don’t have a lot of expirience, so if someone is able to see any inconsistency between parameters I would be very grateful.
Processing burst ID: 42
Azimuth FFT without padding: length 1410
Spacecraft parameters calculated successfully.
Steering rate (rad/s) = -0.025059
Doppler Centroid rate (ks) = 6859.08 Hz/s
Doppler rate (ka) = -2062.00 Hz/s
Baz = 389.656Hz
Bd = 350.691 Hz (Configurable parameter set to 90% of Baz for testing)
Sweeping Bandwidth (Bs) = 4921.006 Hz
Max Sweeping Bandwidth (Bmax) = 7422.676 Hz
Number of spectral replicas + PRF = 4
Reduced burst time (s) = 0.245
Td’ time (s) = 0.22120116098069129
Frequency domain resampling step = 3.781
Doppler centroid = 0.00 Hz
Starting Time UFR processing chain…
Frequency mosaicking…
PRI before mosaicking: 0.00059
PRI after mosaicking: 0.00014
Deramping ks…
Time low-pass filtering…
Azimuth zero doppler time = 0.0
Frequency resampling…
Requested factor: 3.781, Actual factor: 3.780
Original matrix shape = (5640, 19746)
Downsampled matrix shape = (1492, 19746)
Re-ramping ks…
UFR processing complete.
Number of total time replicas = 14
Time domain resampling factor = 14.032
Starting Time UFR processing chain…
Time mosaicking…
Size of the time mosaicked data: (20888, 19746)
Deramping kt…
Frequency low-pass filtering…
Time resampling…
Requested factor: 14.032, Actual factor: 14.028
Re-ramping kt…
UFR processing complete.
Burst Parameters:
Swath ID: 3
Burst ID in Swath: 8
Number of Range Lines: 19746
Number of Azimuth Lines: 1489
Range Bandwidth: 46916026.703 Hz
PRF: 480.69359697656694 Hz
Azimuth Bandwidth: 480.370Hz
Burst Time. 0.836 seconds
Focused Image Time: 3.095 seconds
Range samples: 19746
Azimuth samples: 1489
The product that I am using is: S1A_IW_RAW__0SDV_20250410T052657_20250410T052729_058690_074497_F18E.SAFE
If I consider one replica less I get the following focused image:
Dear @melis
yes the elevation antenna pattern is in the AUX_CAL product.
You can get it from the CDSE/Copernicus Browser.
You can just search for AUX_CAL without selecting any other filter.
Which is the expected number of frequency and time replicas in the mosaicking steps of unfolding and resampling processing in TOPSAR for S-1? If the number of replicas is odd, the replicated spectrum will not centered.