I have downloaded the Sentinel dual-polarization GRD IW mode product (VV+VH) and have run the pre-processing and got the final gamma0.
I am working in forest areas. When I visually compare VV band image and VH band image to each other, I see more brightness of pixels over the forest areas in VH pol rather than VV pol. But if I zoom to that brightened pixel, I see that the value in dB or power in VH band is less than the value in VV band polarization.
if you want to compare two images visually, make sure you apply the same contrast stretch to both images in the color manipulation tab.
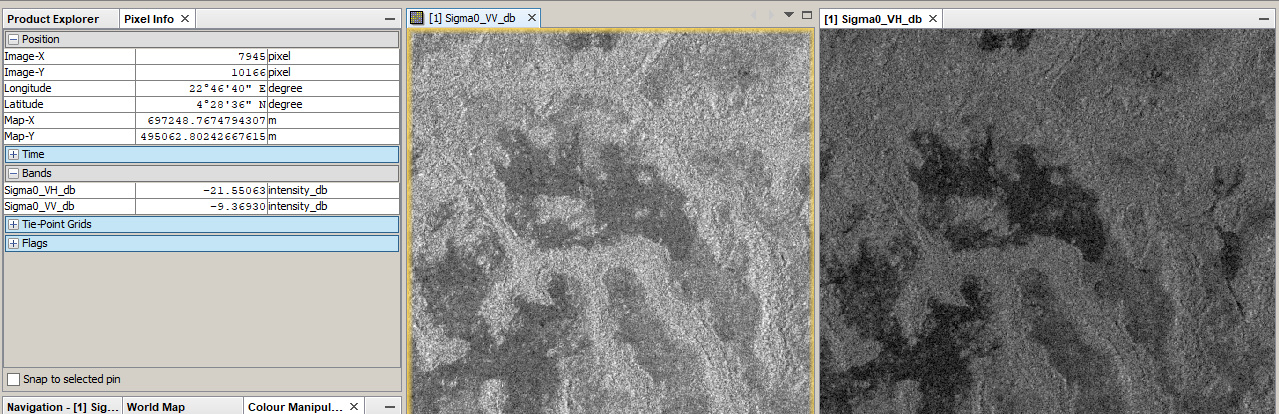
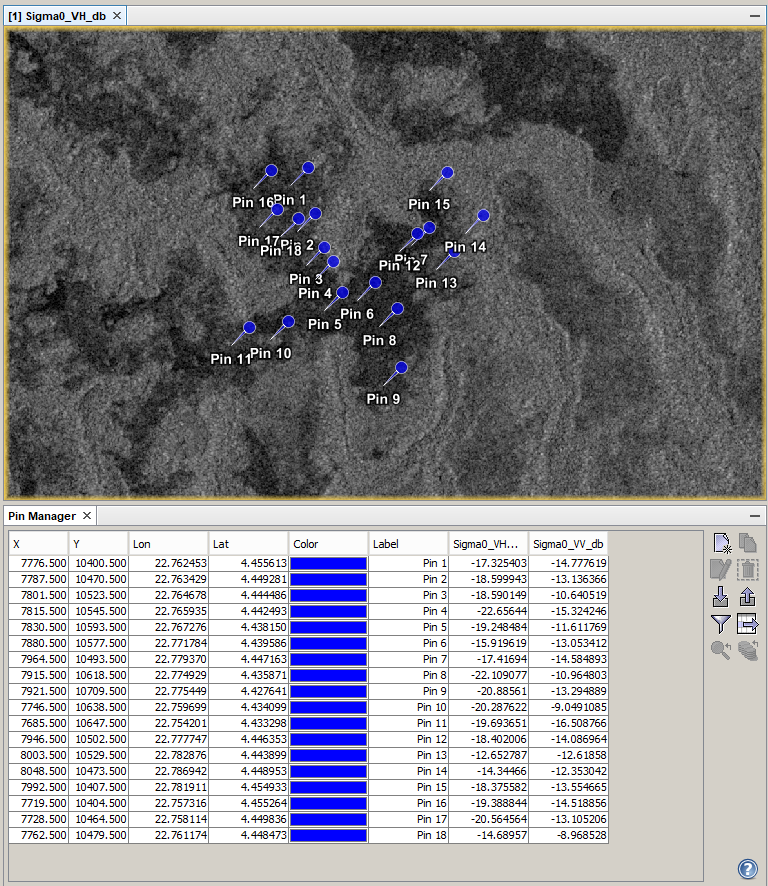
When you want to compare the values of two images statistically, you can use the pin manager (pixel values under selected pins) or the pixel information tab which shows the pixel values under the cursor.
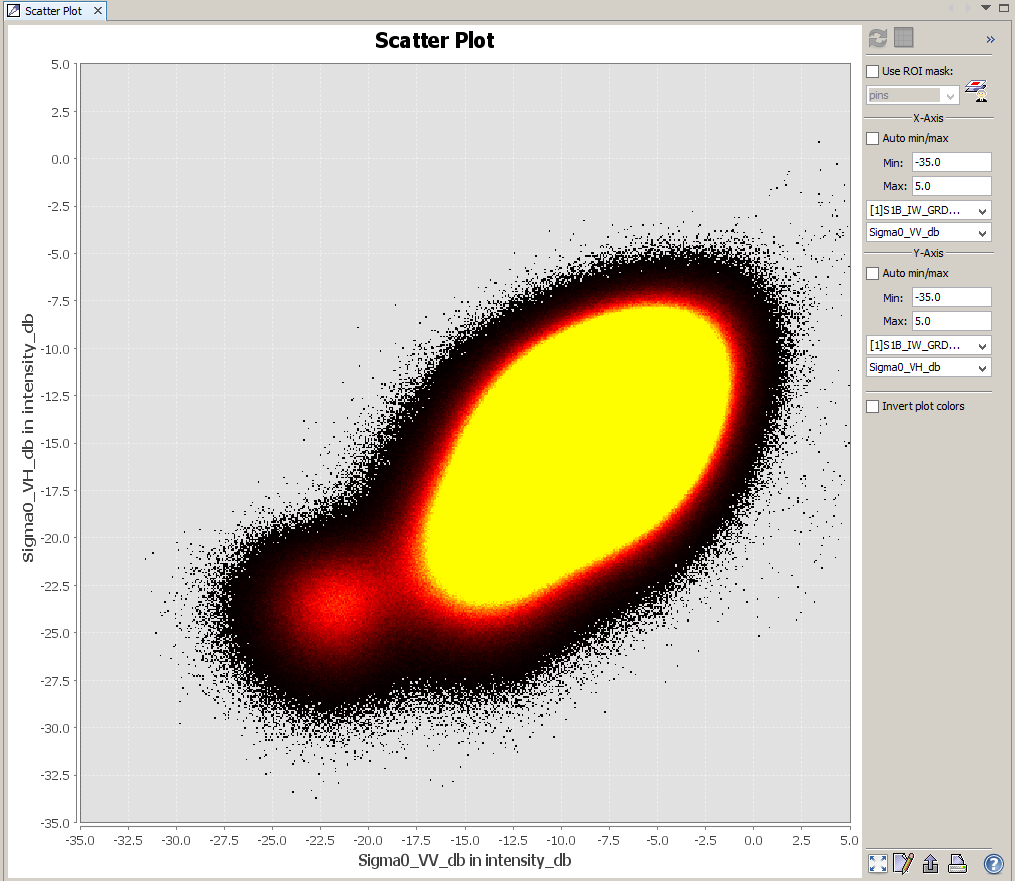
VH has geneally lower backscatter than VV except for areas of volume scattering.
I am not applying any enhancement filter as of now.
I am checking for the values where there is definite volume scattering i.e forest areas otherwise that area wouldnt have appeared bright in the first place in VH.
If the pixel is appearing brighter in VH that means its value should be close to zero when compared to the same pixel value in VV. I dont see this result. Can you help?
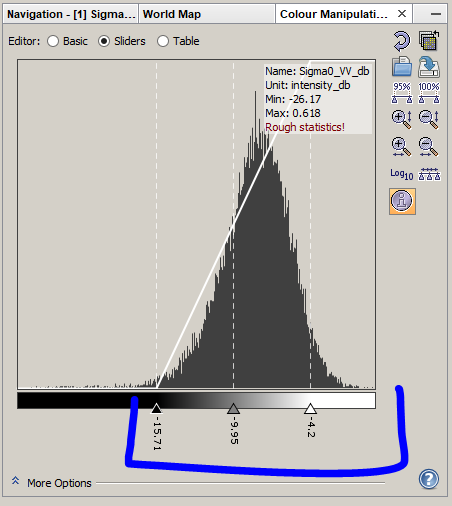
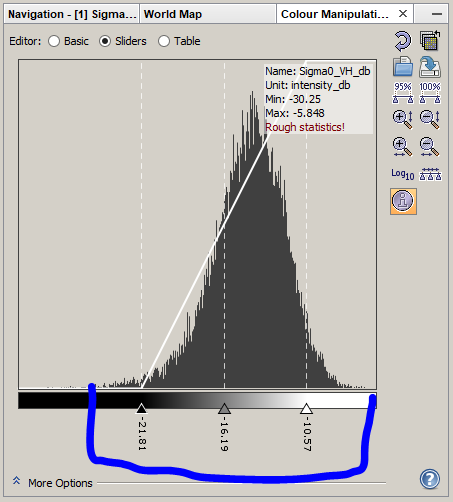
with “contrast stretch” I did not mean an active change of the values. Just to make sure that the colors you see represent the same value range. As VH has generally lower values, the greyscale is stretched over a different value range.
Note how the min/max values are shifted by about 5 db. You cannot say an area is “brighter” or “darker”, as long as the two images refer to different color ranges.
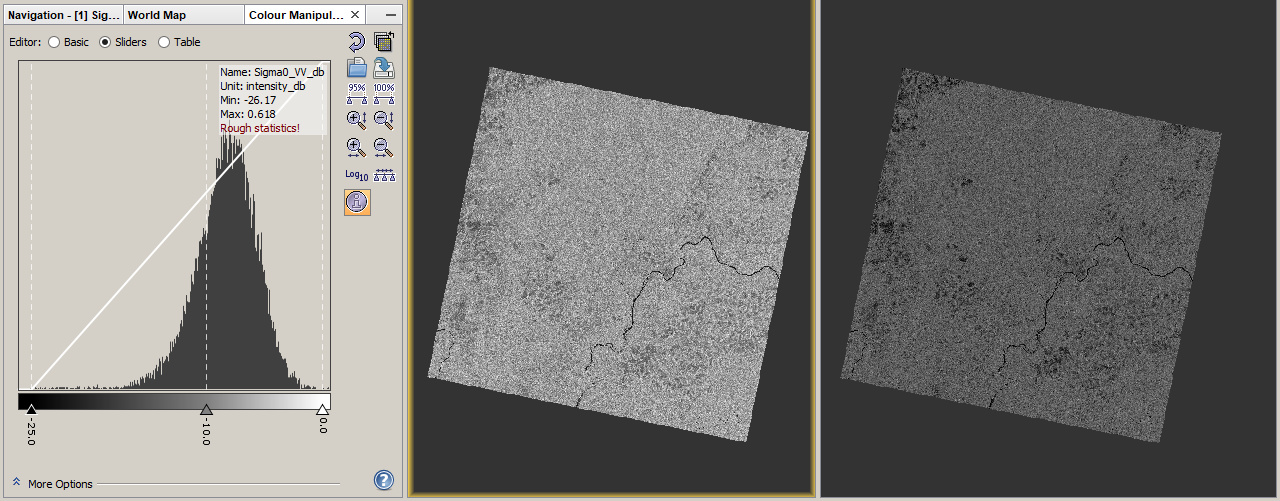
Once you apply the same contrast (e.g. -25 to 0) to both images, they are visually comparable:
Yes, the first one is the VH-VV polarisation ratio and the second one a normalised measure of how much the backscatter differs in the two polarisations.
both polarizations can show high shares of volume scattering. VH not necessarily higher for volume scattering, but shows more pronounced patterns regarding vegegation.
Cross polarization is usually smaller because it is only the proportion of polarized waves (V turning to H) returning to the sensor.
Thank you for the explanantion. I have been using that book. So as per the book and the papers that I have read on forest, VH is the polarization to be used for the forest studies, except for few indices where it employs both VV and VH.
@aakash.chhabra7489 I was just referred to this post regarding a question I had, and saw that your most recent question is unanswered. I think I can help out with that.
To my knowledge, there is not a tool built into SNAP that will let you re-scale the pixels values to be in an arbitrary range. You will have to implement it manually using band maths. But since band maths can only get the value of a single pixel, you will have to hard code the min and max values into your equation.
An equation to remap the values would look something like this, (assuming you want to remap a VV band that currently has a minimum of 3.2 and maximum of 56 to be in the range of 0 to 10):
(VV - 3.2) * (100 - 0) / (56 - 3.2) + 0
I based this off of the map() function that is can be used when programming Arduino development boards.
Hi…I imagine that there is no broad methodology which could be applied. Obviously, SAR power is affected by soil dampness. Yet, it is additionally impacted by unpleasantness and state of the surface. So as indicated by my comprehension at any rate two things are fundamental for soil dampness planning:
Multi-worldly information: You can not recover soil dampness by a solitary picture. Variety in SAR backscatter throughout a more drawn out time, (best case scenario, among blustery and dry seasons) gives you the variety which can be considered typical.
Hello Sir.
I want to do research on rice phenology mapping using SAR data. I have preprocessing SAR. I’ve done apply orbit,thermal noise,border noise, calibration then speckle filter, terrain correction then linear to db. Do i have to go for GLCM after preprocessing? i also want polarisation ratio like VH/VV. Please Kindly give some advice. I’m new to SAR.