Dear user forum,
I will work with Sentinel-2 data and for this reason I have downloaded the data from the scientific data hub and imported into the SNAP software. Now my question.
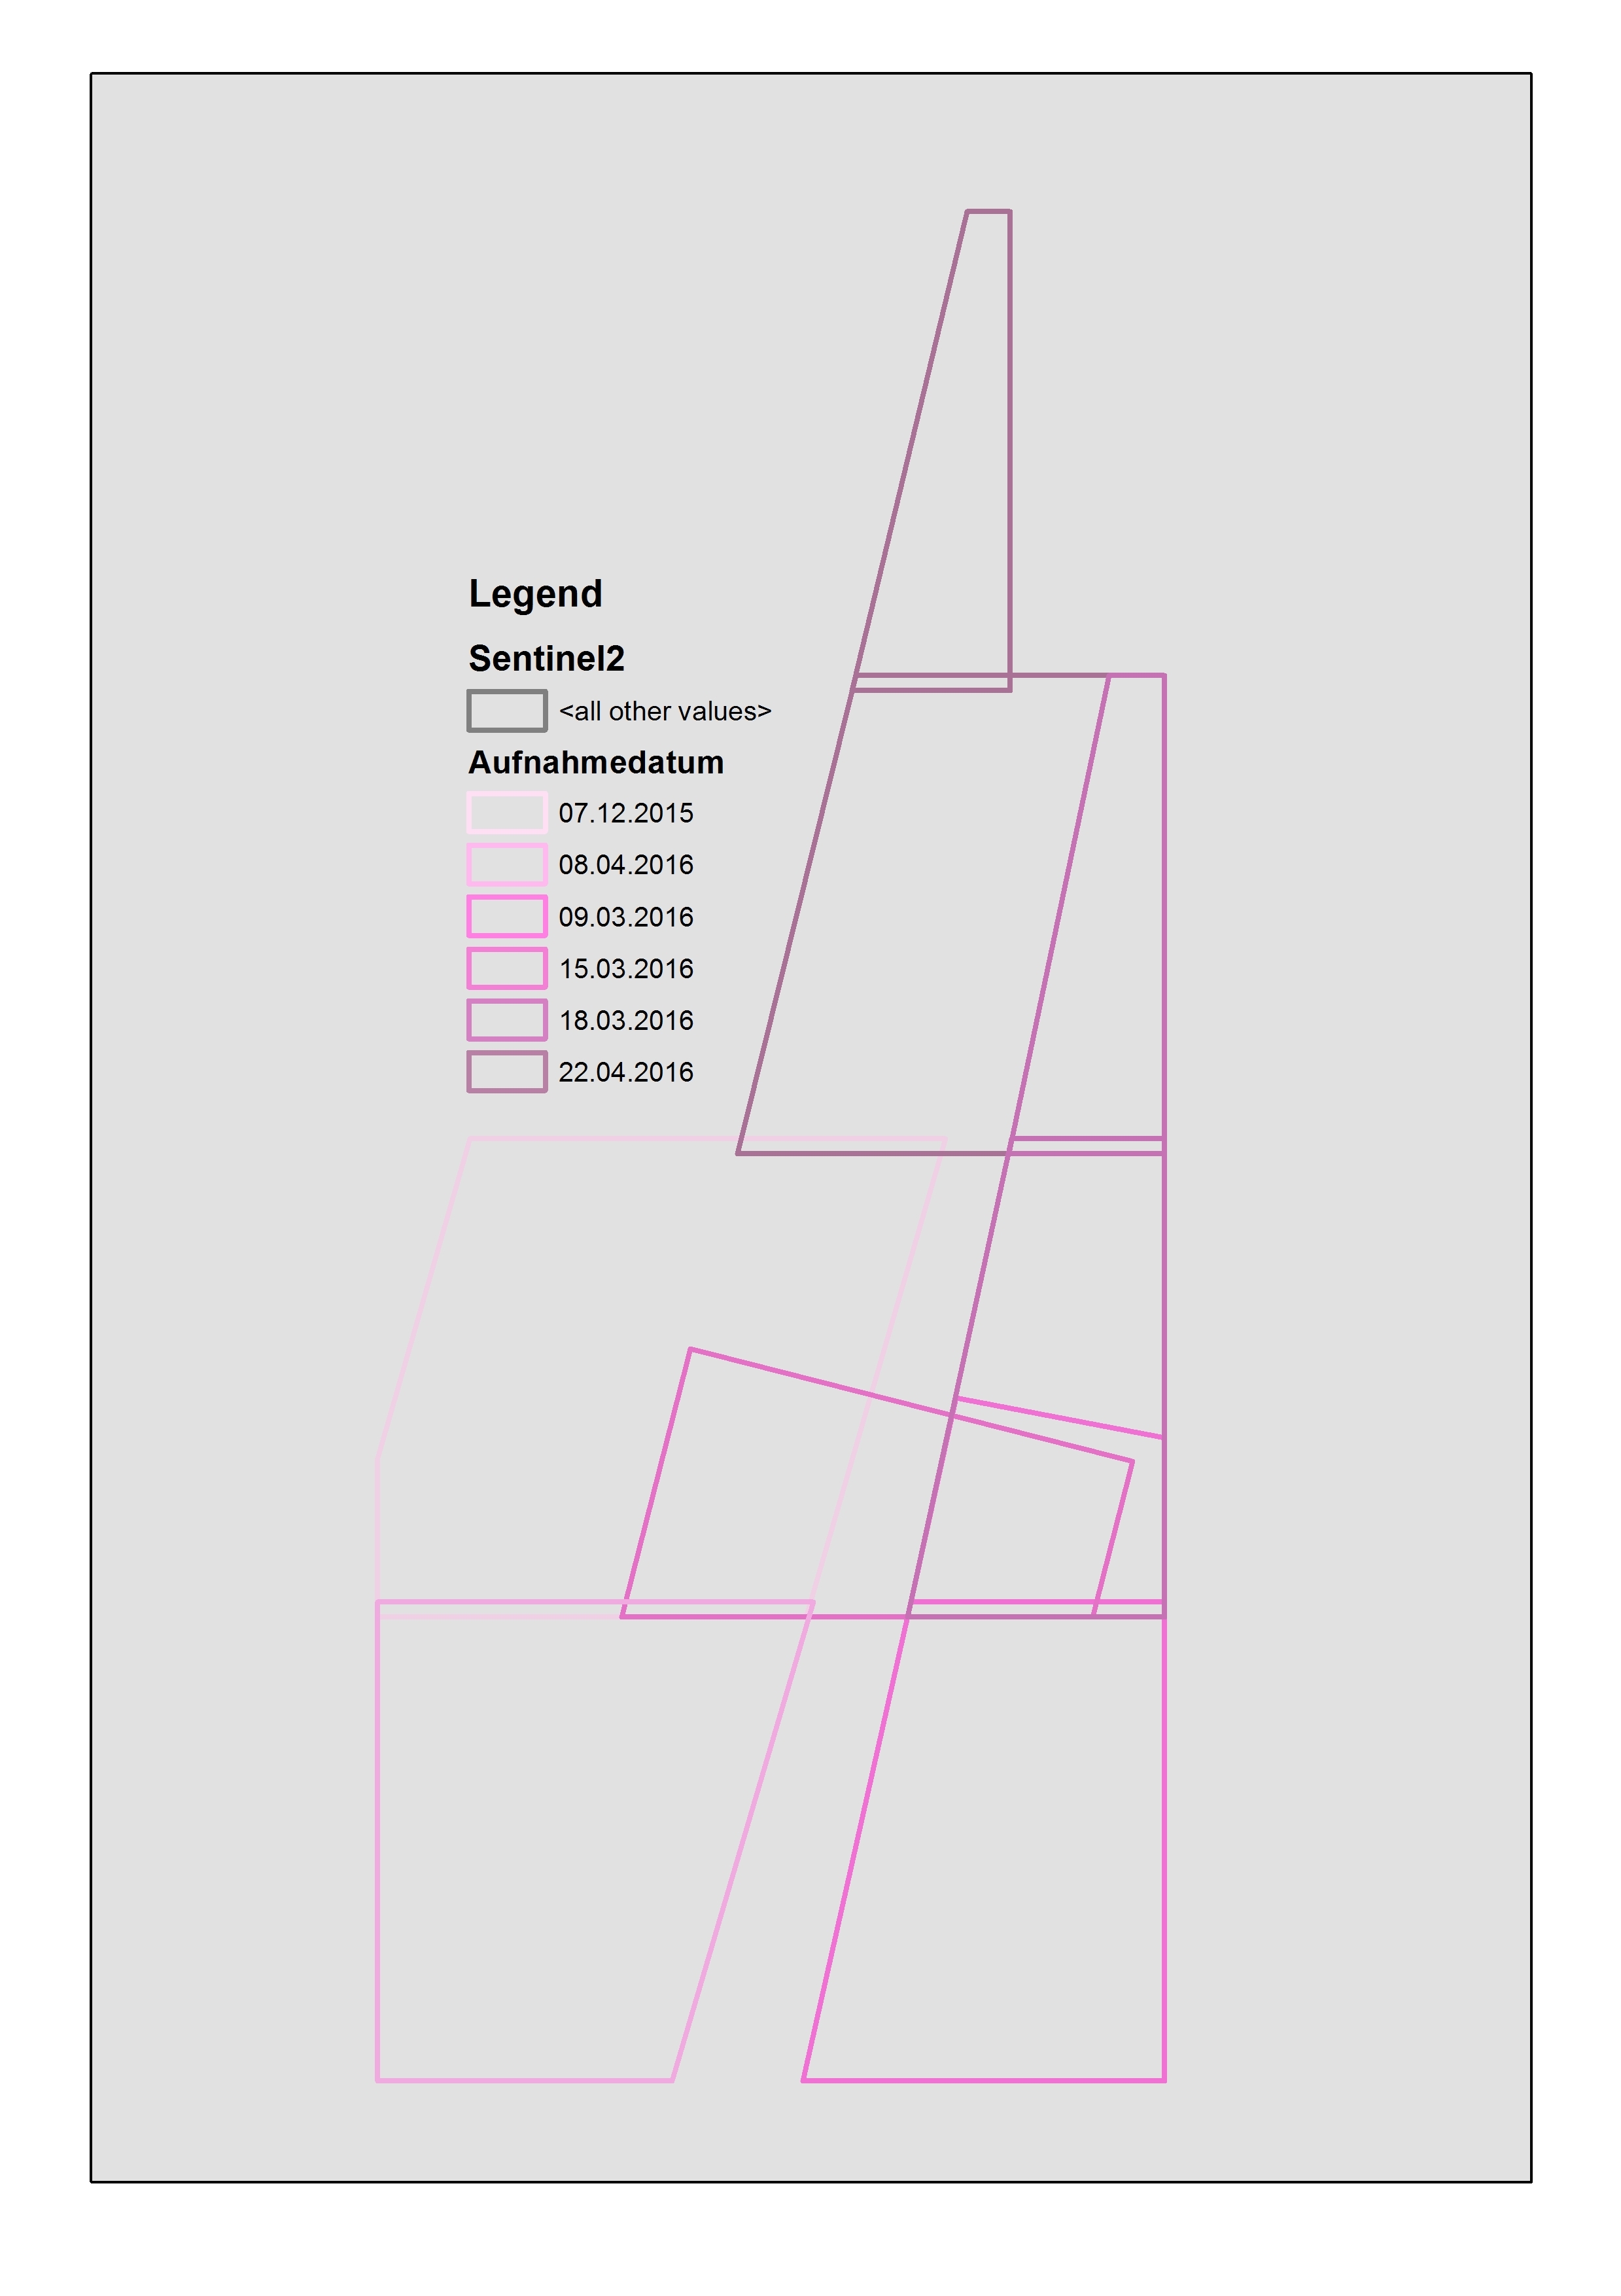
Why have the different datasetsof different areas and different time so different footprints? It looks like that some are cutted. To understand my problem, I have uploaded an example in the appendix. There are different footprints of different dates and the boxes are shown the usable data.
Thanks for the support and regards,
Thomas