Hello everyone ! Can someone please help me understand how the MCI algorithm for level 2 Sentinel 3 OlCI data works so I can compare it to the NN-algorithm.
I don’t have in situ-data unfortunately, so I decided to compare two algorithms, but I didn’t understand the MCI algorithm based in SNAP toolbox.
I’m using level 2 data
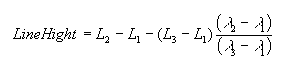
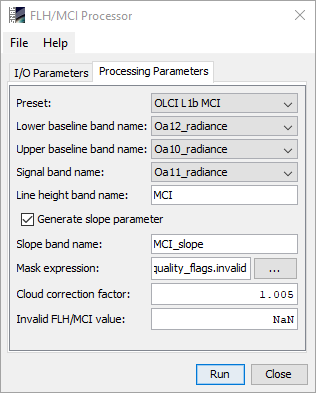
I didn’t know those numbers I highlighted in yellow refers to what exactly and what relation do they have with Chl a concentration
I applied the chlorophyll palette to visualize the distribution but I didn’t understand what is meant by line height and baseline bands
Could you elaborate more please ?
There are a couple of papers by Gower and Gower and King that can help you to understand the interpretation and comparison of the FLH/MCI and chlorophyll products: