Sentinel 5p raster creation

Hi there,

After looking at all the valuable inputs from all of you, I also started digging into the matter. My objective was to create a tiff file from Sentinel 5P data that is available in netcdf format.
So I also came up with a solution.
I used SNAP toolbox for the purpose
I downloaded Sentinel 5P level 2 NO2 product for this purpose using the link below.
https://s5phub.copernicus.eu/dhus/odata/v1/Products(‘2fbd5daf-5b03-4cc3-a7e0-d963f3b63c59’)/$value

The product looked flipped when viewed in the SNAP

Then I subset the dataset using band subset for my required band that was “nitrogendioxide_tropospheric_column”

In this next step I used Reprojection tool in the geometric operation with my prefered Reference system (EPSG:4326)

The output from this step gave me a tiff file that was georeferenced and in tif format… that was my objectice

when i open this layer in ArcGIS it was a three band layer having “nitrogendioxide_tropospheric_column” as Band 1 and lat and long as band 2 & 3

Hope this will be helpful for everybody and I hope somebody will help me with the analysis part as a I am not good with the statistics from here on…

Enjoy…

Regards

Yasir Shabbir

4 Likes

hi @svniemeijer thanks for taking the time to help with questions. I am also trying to automate this process of rater creation using python. I have a couple of questions i hoped you could help me with.
The example i chose was a methane product (google drive file link): “S5P_OFFL_L2__CH4_____010300_20190417T054418.nc”
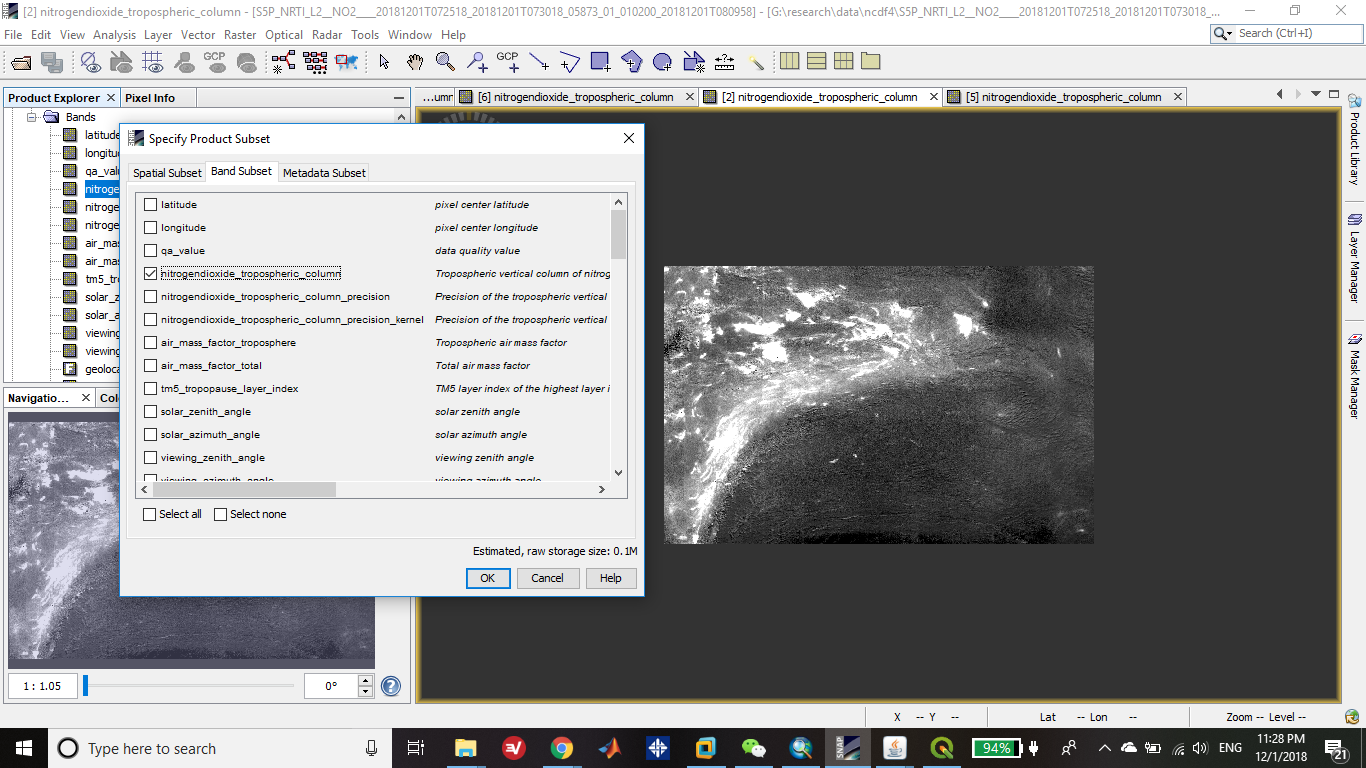
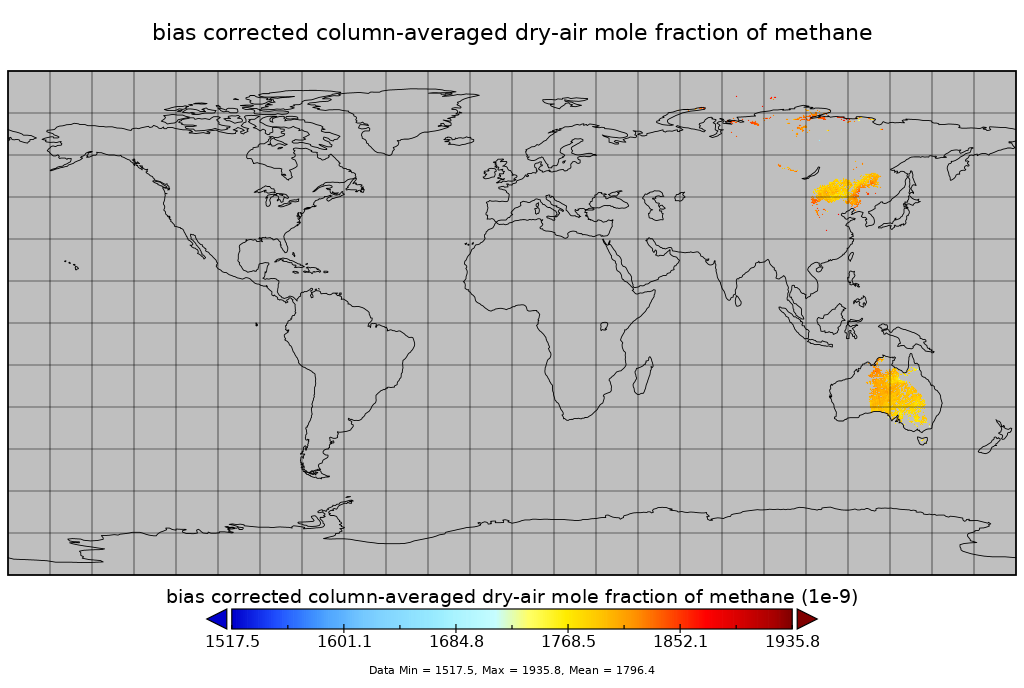
The docs seem to say the images are 7 x 7 km, and images plotted by @luisgpaixao look the right shape, but when i plot this methane product (using panoply here) i get a long strip:


Given each ‘pixel’ has a lat/long I converted the grid to vector points (python snippet below).
printing the lat.min(), lat.max(),lon.min(), lon.max() extents and I get the whole world!
west:-179.9999237060547, south:-89.92754364013672, east:179.9989013671875, north:89.9327392578125

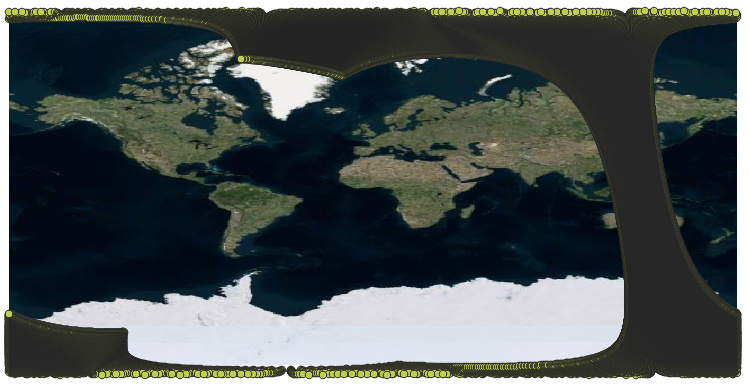
I’m assuming the extreme lats because the strip genuinely seems to got from pole to pole; in which case the extreme longitudes are because the data covers one of the poles where the longitudes are very close together. This is more obvious in a plot of the points from the csv

Anyway, is this data such a long strip because it is a different swath capture (akin to IW, EW etc for sentinel-1); or is it captured differently like this for the methane product?

You mentioned that the harp caommandline tool can bin the data into a regular grid.
Could you show us how to call the same functionality directly within python? I could always call the same tool you mentioned via subprocess(), but it would be great to import the harp api directly and apply the methods from within python.
When interpolating/binning to a geotiff grid, could one simply pass to harp the extents as printed above for this product, even though they are so extreme, or will defining the geodesic ‘wgs84’ simply handle this?

Thanks in advance!
Ryan

@dmichelakis interesitng?

Python snippet used to generate points:

data = Path(r'/home/vagrant/projects/data/nc_files')
data.exists()
methane_variable = 'methane_mixing_ratio_bias_corrected'
netcdf_file = list(data.glob('*S5P_OFFL_L2__CH4____20190411T035326_20190411T053456_07729_01_010300_20190417T054418.nc'))[0]
#netcdf_file = netcdf_list[1] #S5P_OFFL_L2__CH4____20190411T035326_20190411T053456_07729_01_010300_20190417T054418.nc
print(f'netcdf_file being used: {netcdf_file.stem}')
save_path  = netcdf_file.with_name('test.tif') #still havent made this!

nc_file = netCDF4.Dataset(netcdf_file)['/PRODUCT']

lat = nc_file['latitude']
lon = nc_file['longitude']

west, south, east, north = [lon.min(), lat.min(), lon.max(), lat.max()]
print(f'west:{west}, south:{south}, east:{east}, north:{north}')

Hi @Ryan, S5P products consist of full orbits (but only the sun-lit part of the earth), and this indeed covers the poles. Sentinel-1 switches between modes many times within an orbit (i.e. datatakes), but this is not the case for Sentinel-5P. You could compare this to Sentinel-5P having a single datatake that covers a full orbit.

You can easily get the data inside Python using the HARP Python interfaces.
(HARP is available via conda: https://anaconda.org/stcorp/harp):

>>> import harp
>>> data = harp.import_product('S5P_OFFL_L2__CH4____20190411T035326_20190411T053456_07729_01_010300_20190417T054418.nc','bin_spatial(181,-90,1,361,-180,1);derive(latitude {latitude});derive(longitude {longitude});squash(time, CH4_column_volume_mixing_ratio_dry_air);keep(latitude,longitude,CH4_column_volume_mixing_ratio_dry_air)')
>>> print(data)
source product = 'S5P_OFFL_L2__CH4____20190411T021156_20190411T035326_07728_01_010300_20190417T033330.nc'
history = "2019-05-03T11:01:36Z [harp-1.6] harp.import_product('S5P_OFFL_L2__CH4____20190411T021156_20190411T035326_07728_01_010300_20190417T033330.nc',operations='bin_spatial(181,-90,1,361,-180,1);derive(latitude {latitude});derive(longitude {longitude});squash(time, CH4_column_volume_mixing_ratio_dry_air);keep(latitude,longitude,CH4_column_volume_mixing_ratio_dry_air)')"

double CH4_column_volume_mixing_ratio_dry_air {latitude=180, longitude=360} [ppbv]
double latitude {latitude=180} [degree_north]
double longitude {longitude=360} [degree_east]

awesome thanks @svniemeijer , a one liner!
I am using pypi for my python ecosystem, do you have a pypi package release (as opposed to anaconda?).
Otherwise we have been trying to install on the ./configure step not finding hdf4 libraries
this is what we’v run so far (in sudo):

git clone https://github.com/stcorp/harp.git
cd harp/
git submodule init
git submodule update

apt install autoconf automake libtool flex bison
apt install hdf4-tools hdf5-tools

./bootstrap 

./configure --prefix=$HOME/harp HDF5_INCLUDE=/usr/lib/x86_64-linux-gnu/hdf5/serial/include HDF4_INCLUDE=/usr/include/hdf/ HDF4_LIB=/

Struggling to find hdf4_lib!

We don’t have a pypi installation precisely because of the dependencies on non-python libraries such as hdf4/hdf5.

Using HDF4_LIB=/ will not work, you will have to use a path that contains libdf.so and libmfhdf.so

OK that makes sense about the pypi.
i ran

cd /
find . -name “libdf.so

got:

./usr/lib/libdf.so.0
./usr/lib/libdfalt.so.0
./usr/lib/libdfalt.so
./usr/lib/libdfalt.la
./usr/lib/libdfalt.a
./usr/lib/libdf.so.0.0.0
./usr/lib/libdfalt.so.0.0.0

same directory found for ‘libmfhdf.so’
so iv update the configure to run:

./configure --prefix=$HOME/harp HDF4_INCLUDE=/usr/include/hdf/ HDF4_LIB=/usr/lib/

but i still get


ERROR: HDF4 libraries and/or header files are not found.
Try setting the HDF4_LIB and HDF4_INCLUDE environment variables to the
location of your HDF4 library and include files.


is the problem that libdf.so is actually libdf.so.0 <<<--------------------- ?? version number?

You should indeed have libdf.so files without the version number (they usually are provided as symlinks).
Make sure you install the ‘dev’ versions of hdf4/hdf5 if these are missing.

To not further pollute this forum thread with your installation problems, please send an email to harp@stcorp.nl if you have further issues.

SNAP seems unable to open S5P .nc file.


How did succeed in open S5P file?

There might be a problem with the file. What is the name of the product you’re trying to open?

Sentinel 5p is not supported by SNAP in the first place. If you want to use this data you better use BEAT
https://sentinel.esa.int/web/sentinel/user-guides/sentinel-5p-tropomi/software-tools

There was a change in the code of SNAP. That’s why it worked before and now you got this error message. But this should be fixed with the latest SNAP7 updates

Hello @svniemeijer sir…
I want to process the sentinel 5p data and want all the pixel value in excel it is possible with harp and if it is can you please suggest any documentation or manual of harp that will be very useful for me to process further.

Thank You

Hello sir
I want to explore that how bin_spatial will convert time bound in lat long. It will be very helpful if you share bin_spatial back end process.

Thank You
Dimple Jain

Hi, Ursula!

If you know you want to export JSON, you could look for “JSON” in the index of the manual and it’ll send you to page 19, which will teach you about the SPLIT block and then send you to page 39. You’ll find what you want there, except that the text continues to page 40 and that’s where the JSON option appears. (So, yeah, I need another index entry…)
Regards,
tutuapp

hello
i do the two step first subset the reprojection and then i export the result image to getiff
and then open it in arcgis
please the color in arcgis is false color and i want to process this data
how
thanks

colors are not exported by SNAP, simply the values of the raster.

Hi,

Excuse me, I need to process Sentinel 5p data and I need to install VISAN, but I can’t find a link explain this. Could someone help me to manage this.

Regards/ Layali

Hello again,

I tried to open Sentinel 5p data using SNAP7, but I get a message telling

me “a java.lang.illegalargumentexception exception has occurred”. Please find the attached file.

Regards/ Layali

Hi

how may l produce Sentinel 5p in Snap or another format? In Snap nc file does not display.

Hi, marpet

I am using the Sentinel-3 SYN L2 AOD product. Its format is NetCDF. And the latitude and Longitude are also 2D. I also want to convert this product to GeoTiff format. So I wonder if the HARP is also suitable for SYN L2 AOD.

wishes,
haozhu

Hello,
is it possible that this procedure doesn’t work anymore in SNAP 8? I made a subset of an Atmosphere product (.nc) and when i try to reproject (with or without the passage where i make a subset of the data) the reprojection broke the data (expecially the geolocation). It happens with each output format (BEAM-DIMAP, GDAL-GTiff-WRITER, GeoTiff-BigTiff)

Thanks