Hello all, I have some doubts about the results obtained using the Radiometric Normalisation PIFs processor (Sen2Coral) to normalize multitemporal data.
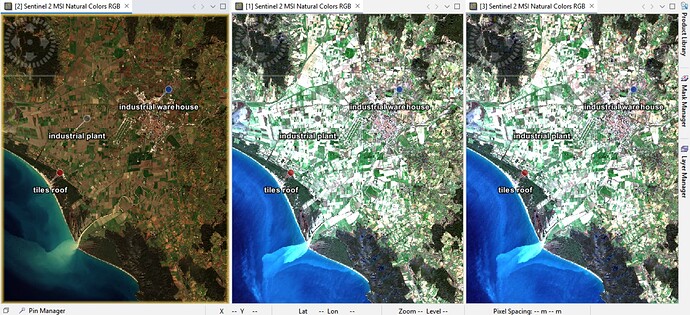
I need to perform a multitemporal analysis on data collected between December 2021 and November 2022 (Image_01).
In order to make the data consistent within the sample, I used the Radiometric Normalisation PIFs processor, taking the February 2022 data (which appears to be the sharpest) and selecting two PIFs on an industrial area cover.
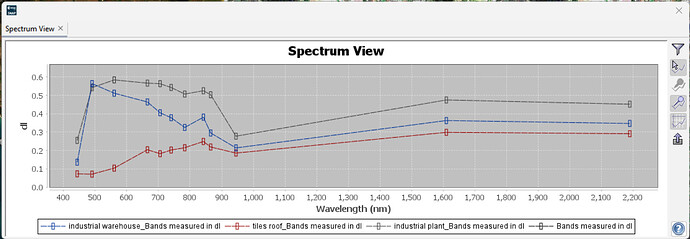
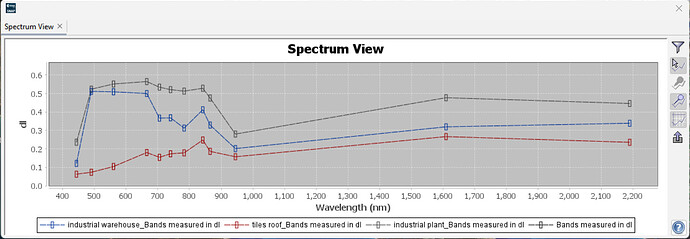
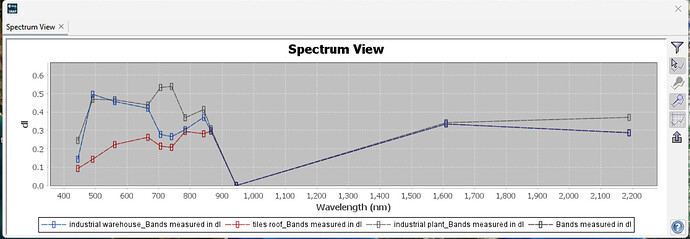
Now, I am not sure I did everything right, since the results seems odd to me. You can see the values of the three sample pins in the Spectrum View attachements:
Image_02) values in the reference images (February 2022),
Image_03) the values in the image from January, before normalisation
Image_04) values in the image from January, after normalisation.
As you can see in Image_04, spectral values in band 9 become zero, and those for bands 1-8a have very different behavior from the ones in the original and the reference image.
Shouldn’t they have a similar behavior to the ones in the reference image, considering that these are roofs or covers of industrial areas?
Thank you!


