Using the Ocean Application tool I had performed Ship detection on Sentinel-1 Image and I need to perform an accuracy assessment on it but got no idea how to do it. If anyone could help me segregate the false detection from true detection along with accuracy assessment it would be a great help. (P.S. - New to SAR data applications)
Thank you!!
Validation works best with independently collected reference data.
So you can inspect your image and manually digitize the ships you identified in a defined region, e.g. a bounding box containin g50 ships.
Inside this box, you count
- the ships which were correctly identified by SNAP (true positive TP )
- the ships which were not identified by SNAP (false negative FN, or ‘miss’)
- areas which were identified as ships by SNAP, but are not ships (false positive FP, or ‘false alarm’)
You cannot count the true negatives (areas which are correctly identified as no-ship), therefore you can only compute the following measures:
- true positive rate (also sensitivity): TP / (TP+FN)
- precision: TP / (TP+FP)
Here you find how to interpret these: Evaluation of binary classifiers

I had exported the Sigma0_VV_ship_bit_mask file as kmz to be viewed in Google Earth and the detection bounding circle and the detection objects are in different places. As seen in the pic above.
this could be because of
- coordinate imprecision of the csv file
- projection of the data which not fully represents the geoid
@marpet do you have an idea if this offset can be caused by reprojecting of ocean imagery?
On performing Geometric Correction (Ellipsoid Correction - Average Height Range Doppler) on the ship detection image I am getting the same result/error. I tried it out with different Geometric Corrections and got the same error.
Don’t think so.
How are the detection circles generated? Are they taken from CSV file?
Then the “imprecision of the csv file” can be a reason.
@avibruce What’s the result if you import the coordinates into SNAP?
I had performed the SNAP Ocean Object Detection tool for the detection purpose. I have just started out with SNAP and SAR data so I don’t have much info on it but on checking the CSV file it does have the Detected_x and Detected_y (which I had deducted as the Location of the bounding circle so I guess they are taken from CSV file.
The result is the same in SNAP.
Then the wrong locations are written to the CSV.
If they are off in SNAP too, then the coordinates are probably not correct.
You can compare the location in the pixel-info view or in the status bar.
You can also set pins on the detected objects and export the pins.
Pins are also included in the KML export.
@lveci can you check the writing of the CSV file?
1 Like
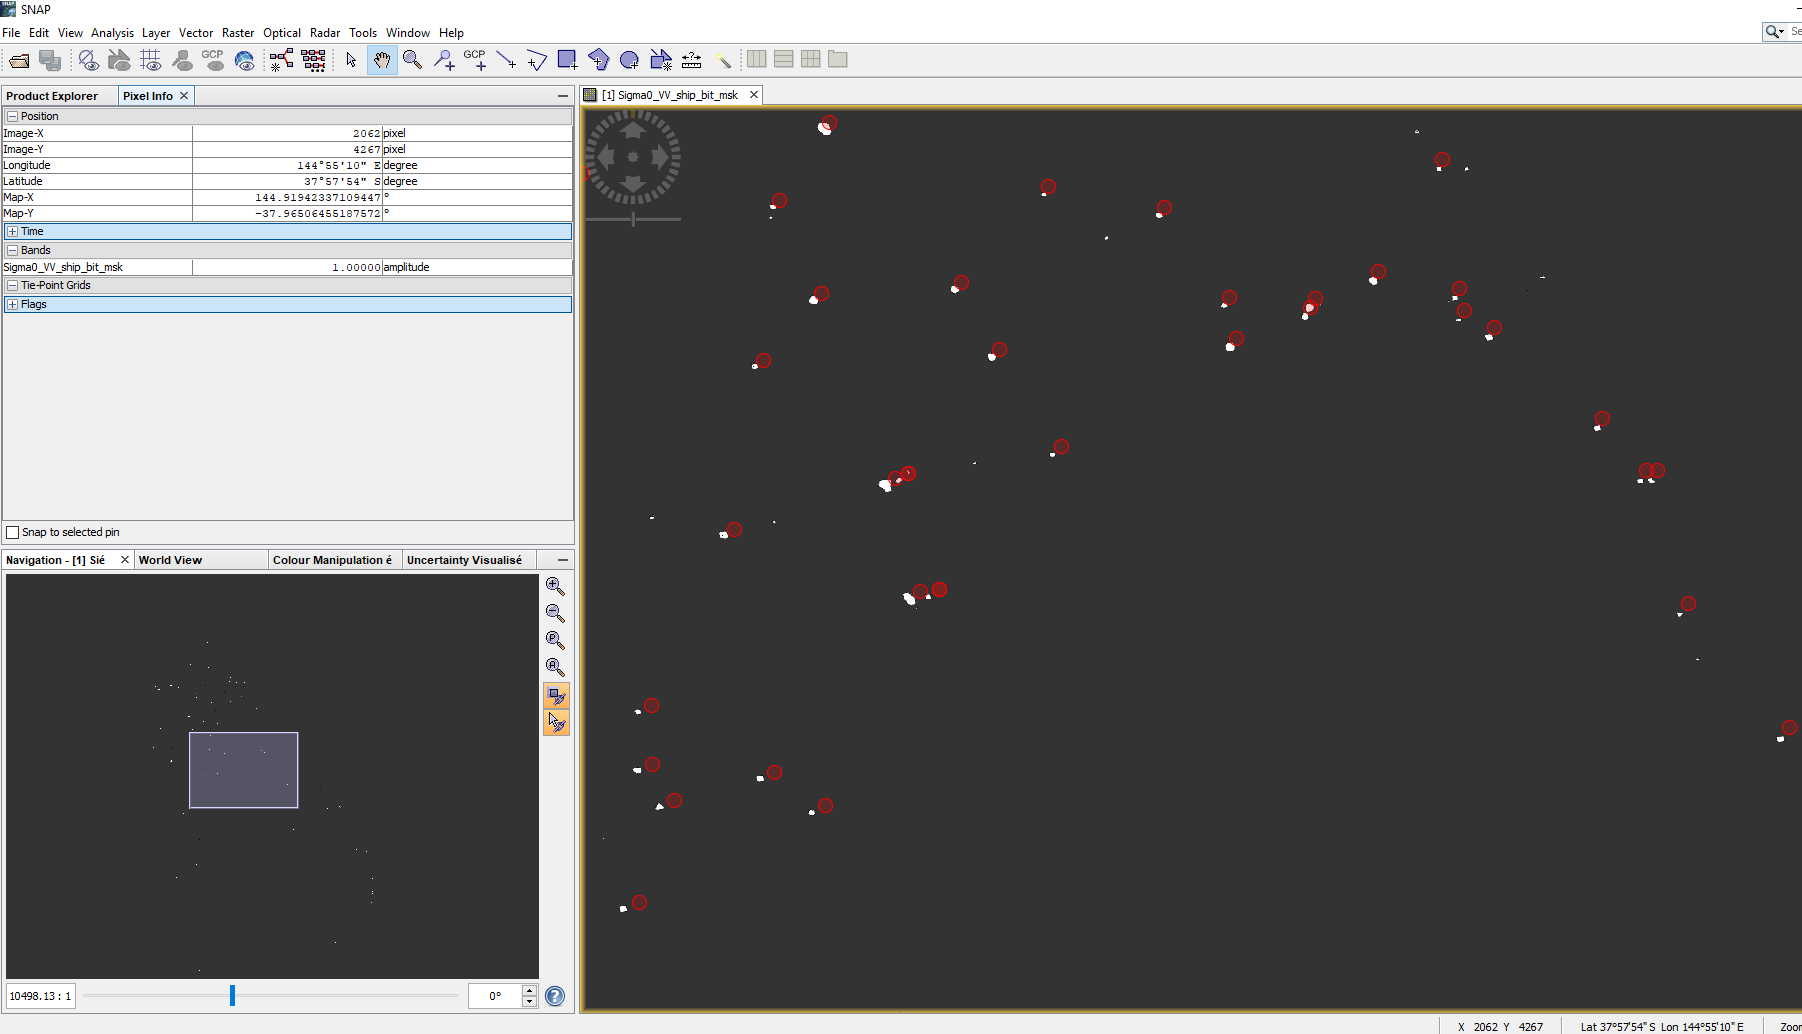
On opening the image in SNAP.
The image below shows the Shipdetection.csv file generated on performing Ocean Object Detection and then applying Geometric Correction (Ellipsoid Correction - Average Height Range Doppler).
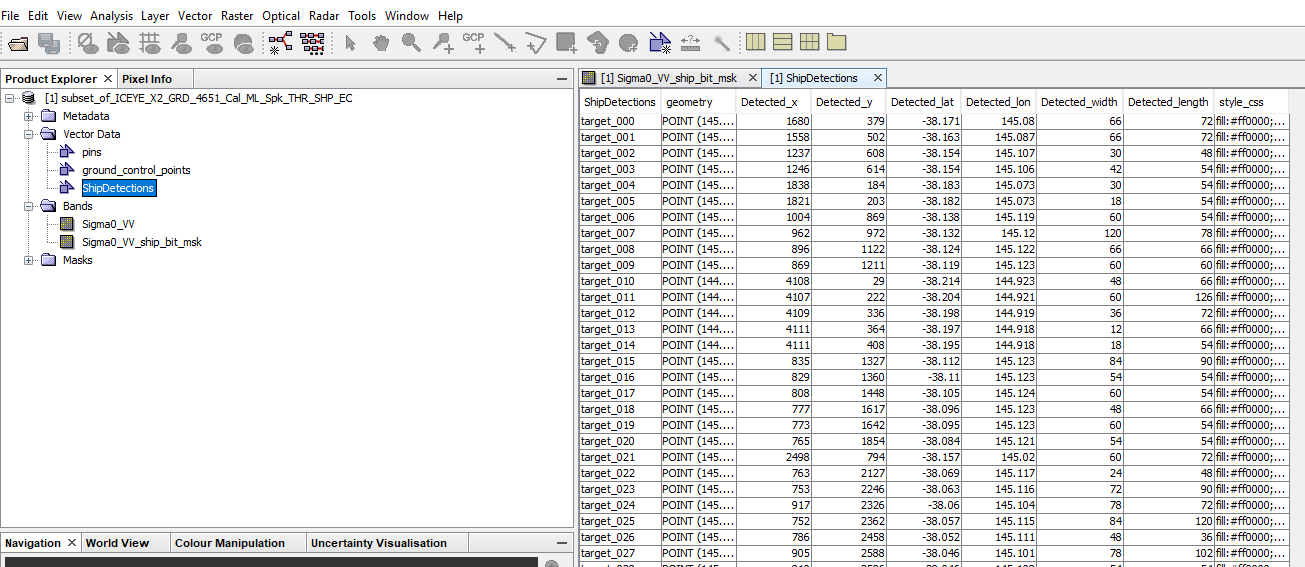
1 Like
Hmm I wonder if at this location there’s a larger than average hight difference between the ellpsoid and the geoid?
The coordinates have only 3 decimal places. This is probably not enough. If you compare one of the the csv locations with the actual object location.
What are the coordinates.
What’s the resolution of your data? 10m?
For high resolution SAR data at least 4 decimal places are needed better 5 or 6.
3 decimals is only 100m.
See: Approximate Metric Equivalents for Degrees (usna.edu)
@lveci Are you cutting to many decimal places?
Or is this only a problem of the metadata display?
1 Like
How can I set the number of the decimal places in coordinates to 4 or more? The resolution of data is 3m.
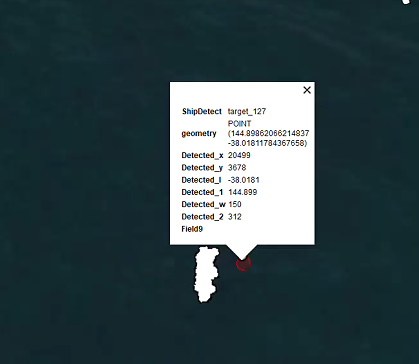
fig1
The ship detected coordinates for target_127 is as shown above in the image. This is the same in SNAP (Pixel info) but in the CSV the location is different for target_127.
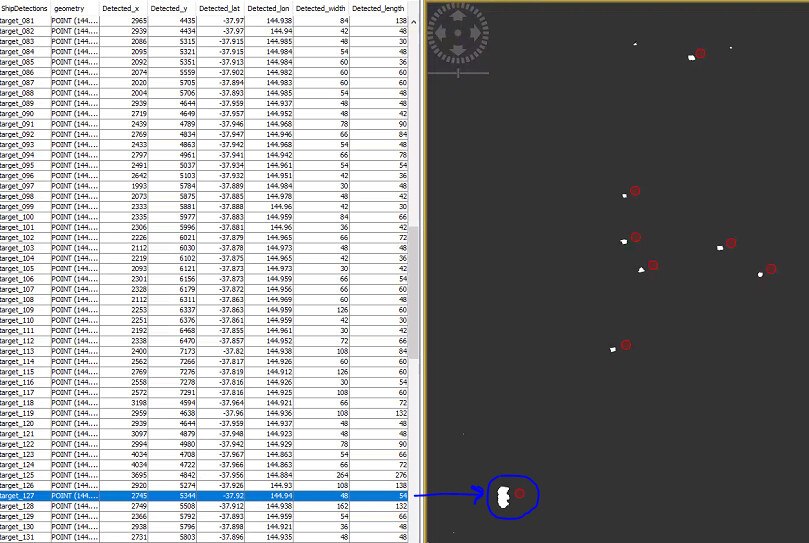
fig2
I don’t understand the how the difference got generated? fig1 is the shapefile generated from the Lat long in csv but when opened in google earth the location co-ordinates are different.
If anyone could explain it would be a great help for me.
Thank you.
You can’t change the precision. However, the values you show in the Google Earth example show more decimal places. So, I guess the CSV is okay.
Probably the metadata view shows only the most significant decimal places.
There must be another reason for the displacement. It is better that @lveci has a look at it.