I am new to this so bare with me.
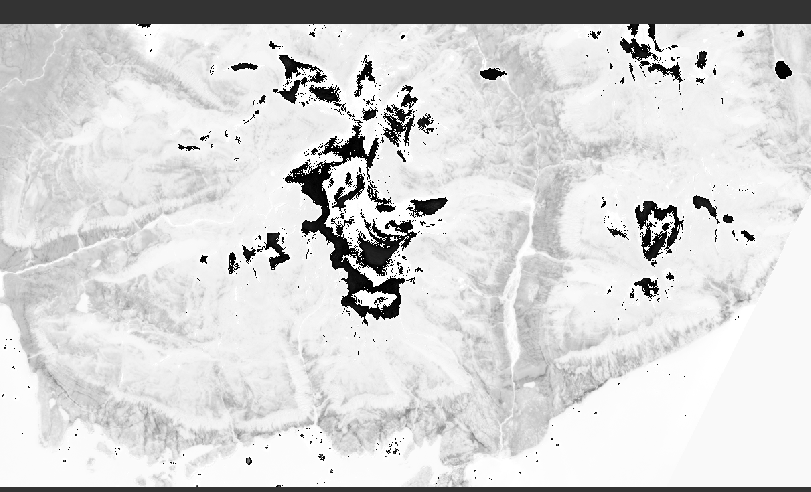
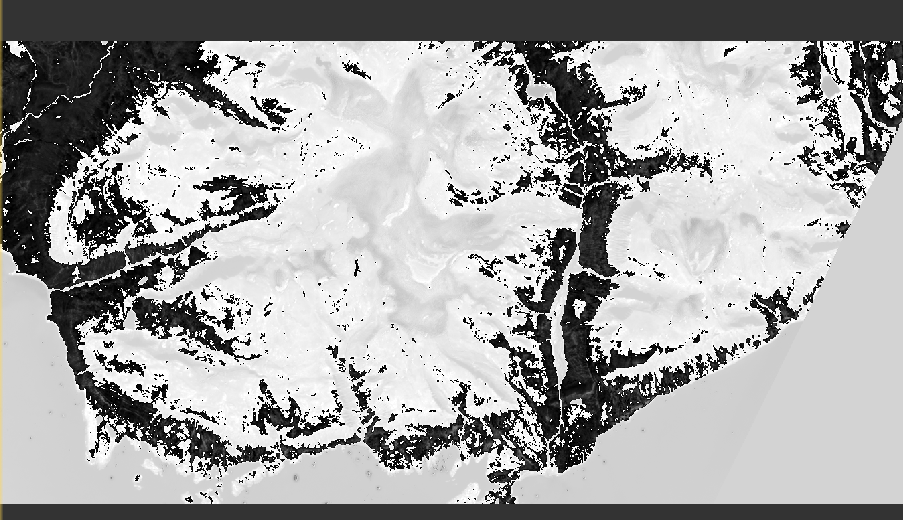
I would like to map the abundance of 3 different types of snow (red, green and clean) on a glacier based on spectral field measurements. My thoughts were to use the spectral unmixing tool, and the field measurements with the 3 snow types as endmembers. The outcome was 3 bands with grey images. I am unsure what the next step is or if it even worked. Or if this was even the correct method for what I am trying to do.
one of the most important points for (fully constrained) spectral unmixing is that all available surfaces have trained endmembers. If you only have field data for the three types of snow I recommend to mask out all non-snow areas first. Otherwise the method will produce unrealistic outputs.
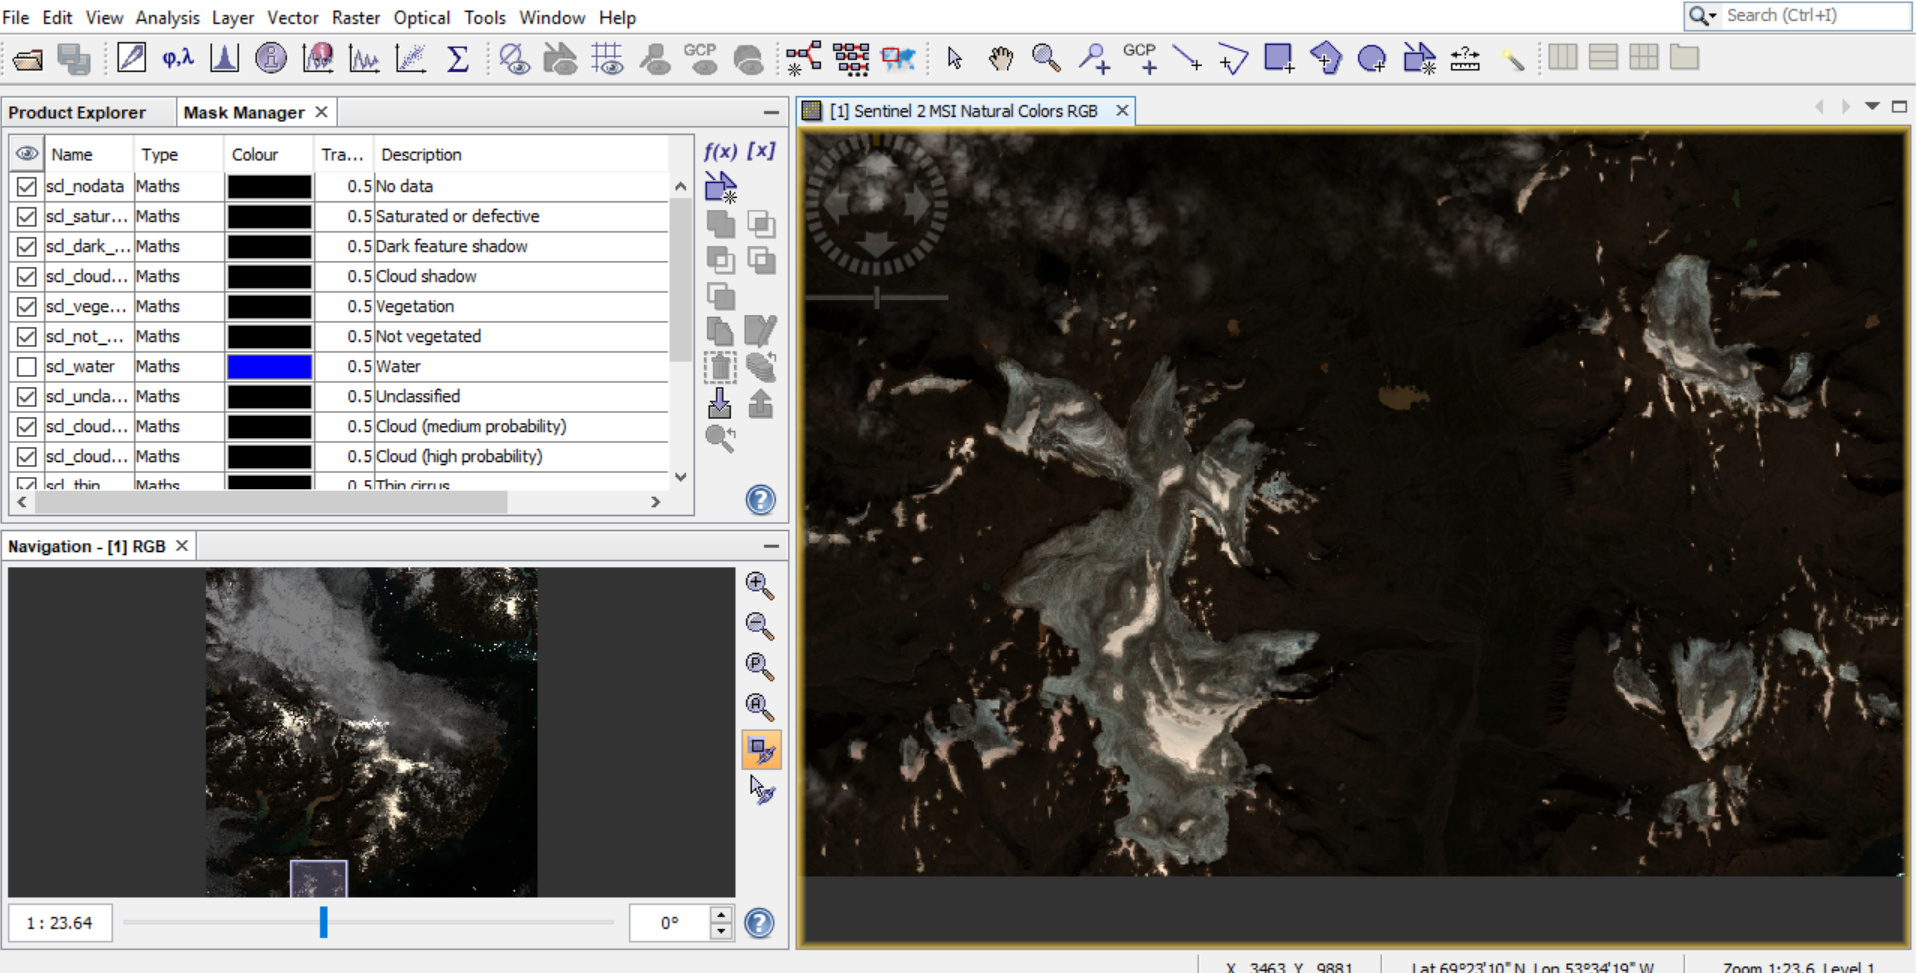
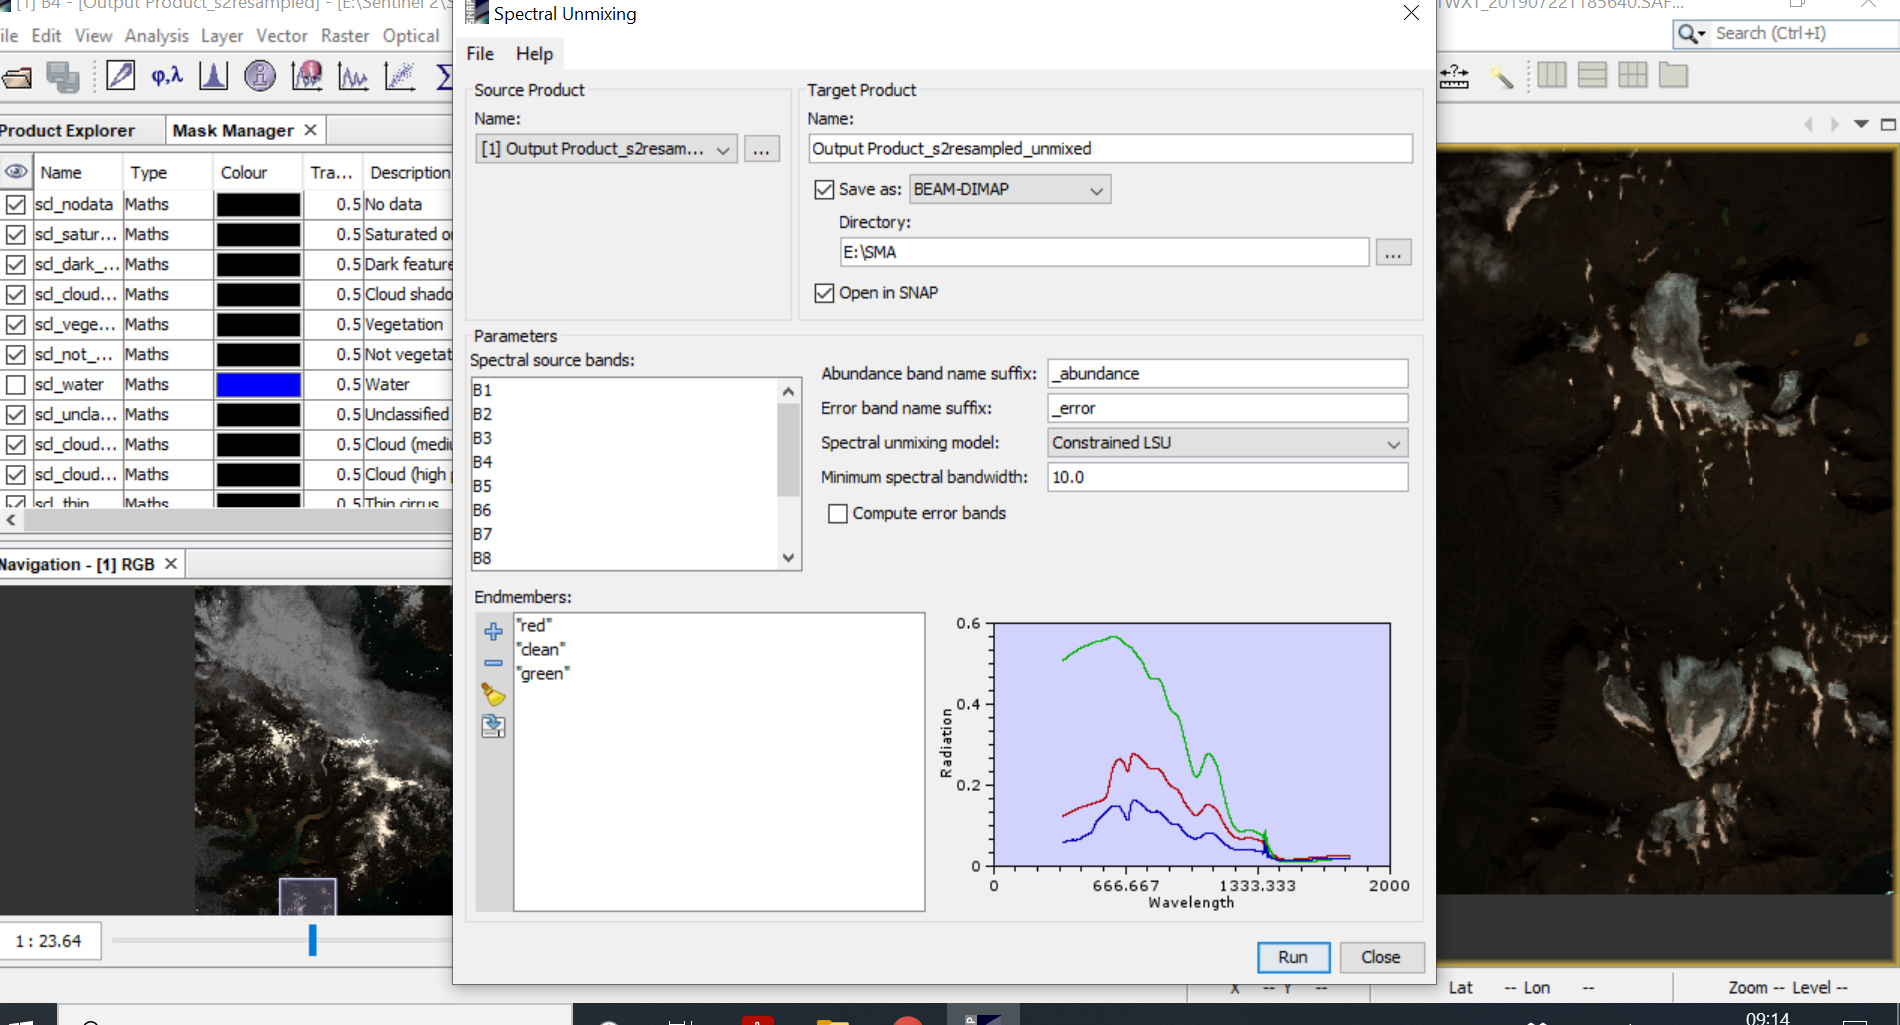
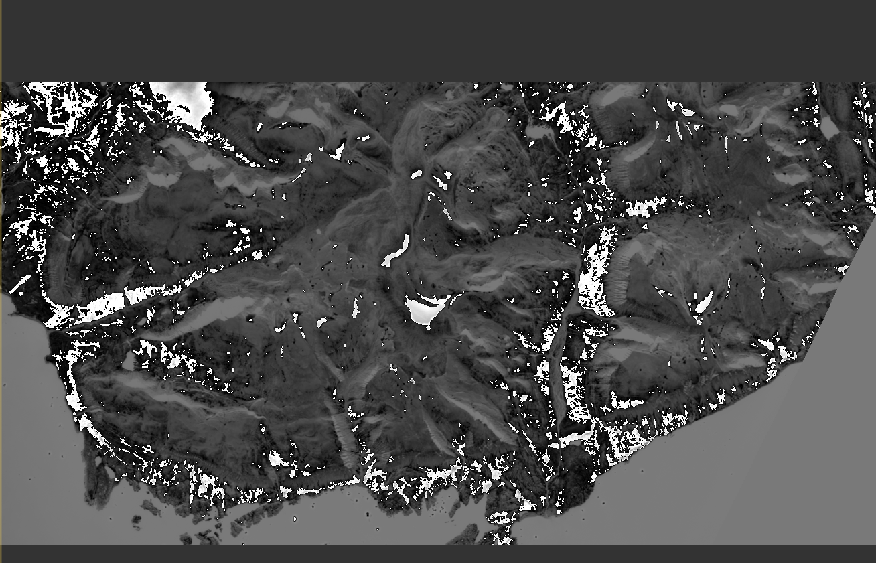
So this is the screenshot of the site (glacier). I have used the automated masks to mask out everything other than the snow/ice. Is that sufficient? If yes, can I then run the spectral unmixing tool with these endmembers (other screenshot)?
I am unsure how to read data? Like I wrote in the beginning, I would like to see if I can map the abundances of the three types of snow on the glacier.
Sure.
Sorry, but how do I read the value ranges? I am unsure what I am looking at. I feel that I am missing information to understand the image. I was hoping to get some numerical data about the abundance of the different endmembers.
I saw that one of your products ends with jp2
I recommend sticking to the BEAM DIMAP format because it conserves all necessary metadata.
Actually, the output should contain one band per material/endmember where each pixel has an abundance value (depending on the selected unmixing method).
I have read in previous studies that they used endmembers for spectral unmixing that provided information on endmember abundance (0-100%). but I have no idea what to do now to get the abundances?
you can use the Pixel Info tool and move your mouse over the rasters to get the fractional abundance (0-1) of each endmember. You can also have a look at the histogram to see the overall value distribution of each band.
Ah yes I see. I get weird abundances though. Some negative values and values over 1. As far as I can red, this may be because of spectral ambiguity?
Lastly, do you know if there is a way to now map these abundances. Say I want to see where the abundance is above 0.5 for example and put them on the RGB map.
yes, this is where it becomes tricky. If there are signatures in the pixels which are not covered by the endmembers, you will get really weird results (because fully constrained unmixing will always try to sum all three classes to 1 [=100%] per pixel)
Therefore you can also try unconstrained unmixing. The pixel values of the three classes will no longer sum up to 1 but you will get more realistic relative distributions.