Smoothing and edge preservation characteristics

Hello, I am a new in INSAR. I think my question is so simple but I can not find the answer anywhere. I am comparing the speckle filters. After make the speckle filtering, I need to extract the value like in the table to find to most suitable filter for one area.
Image 1
Can you please show me how can I get these values.
Thank you!

Please explain what NM, STM and EI stand for or at least provide the source of this table.
Also, no Lee filtering is done for InSAR processing, maybe you can elaborate a bit more so we can understand your problem.

Hi ABraun, I found the table in the article below ( part 3):
http://marte.sid.inpe.br/col/dpi.inpe.br/sbsr@80/2008/11.18.12.44/doc/7299-7305.pdf
NM - Normalized mean
STM - Standard deviation to mean
EI - Edge Index.
I want to enhance the Sentinel 1 images, so I make the speckle filter for images. I want to make comparisons to have a basis for assessing which filter is most suitable for my research area.
Or if you have the other method to choose filter, please suggest me.
Thank you!

Thank you.
To assess and compare the outcomes of different filters you can create a polygon over a homogenous area and then use the statistics tool to calculate the mean and standard deviation (also coefficient of variation) of this area before and after the different filters. This lets you decide objectively which of them creates the most homogenous result.

1 Like

Dear ABraun,
Thank you so much for your helping! I found analysis tool in the SNAP.
But in the result of analysis tool, there is not EI ( Edge Index) value.
Do you know where can I obtain it?

By the way, I have more questions:

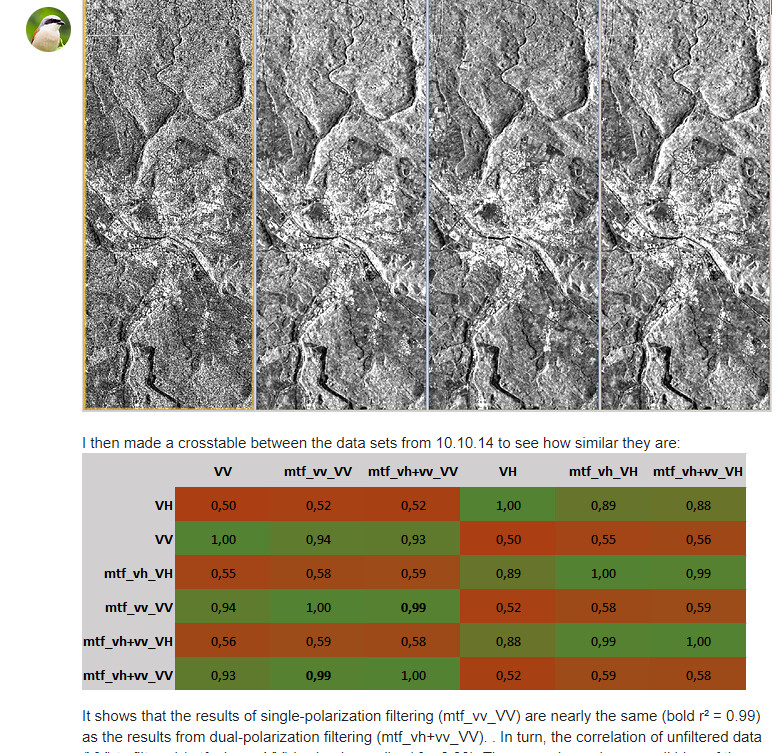
  1. I found this table in your reply in Single or Multi-temporal speckle filter?


    Values in the table are r^2.
    Please let me know, what is r^2? And how did you get it?

  2. I use 44 images Sentinel1, SLC. After speckle filtering with steps for each image:

  • TOPS Split
  • Apply Orbit file
  • Thermal Noise Removal
  • Calibration to Beta0*
  • TOPSAR Deburst
  • (Speckle filtering)
  • Range Doppler Terrain Correction
    Can I do next steps: Back-geocoding–>interferogram formation → Tophographic phase removal ( DINSAR) ?
    then work as normal with PSINSAR ? Because I caculate land subsidence of study area.
    Thank you so much !

You can compute different edge detectors by right clicking on a band > filter. I don’t know where the edge index in your study is from so it might be different.
The R2 in my example is the coefficient of determination. It explains the similarity of two raster bands. Looking back, I don’t think it was a good cchoice vcomputing it for the entire raster because this barely highlights their actual differences. Maybe it makes more sense for small selected subsets.
I computed it in ArcMap, SNAP doesn’t feature this. You might be lucky with QGIS though.

Once you calibrate to Beta0 all phase information is lost, but you need it for InSAR.
Preprocessing for PSI is different from the standard DInSAR workflow. Please have a look at the materials collected in this topic: StaMPS - Detailed instructions - #2 by ABraun

1 Like

Hi!
Thank you!
I tried to work with PSI and had results.
Then now I think that if I enhance the quality of S1 images by the speckle filters, the land subsidence results from PSI will be more precise.
Is my thinking correct?

Not really. Speckle filtering is applied to intensity while InSAR makes use of the phase.
There is Goldstein phase filtering to address this.
But PSI haz its own technique to deal with areas of bad phase quality, so I’m not sure if this really helps.

Thank you for helping me clearly so much!