I am trying to use SNAP 5.0 to look the profile of of a swath of S2 data.
However, when I try to compose even the smallest line (over say 1 detector) the software hangs, and I have to End Process in the Windows Task Manager to get back to my data.
I use the Line Drawing Tool to make a Line, then go to Analysis > Profile Plot and everything stops.
My SNAP is fully updated. I am using Windows 7 64 Bit, and have 16 GB of RAM. You’d think that would be enough, eh?
I just tried it and first experienced the same behaviour: I direcly chose the plot tool in the menu bar. The symbol stayed ‘clicked’ and the GUI froze for about half a minute.
Yes this is not ideal. The GUI should ne blocked this way. It seems reading from the S2 products takes to long time. I’ll consider this as an issue (SNAP-678).
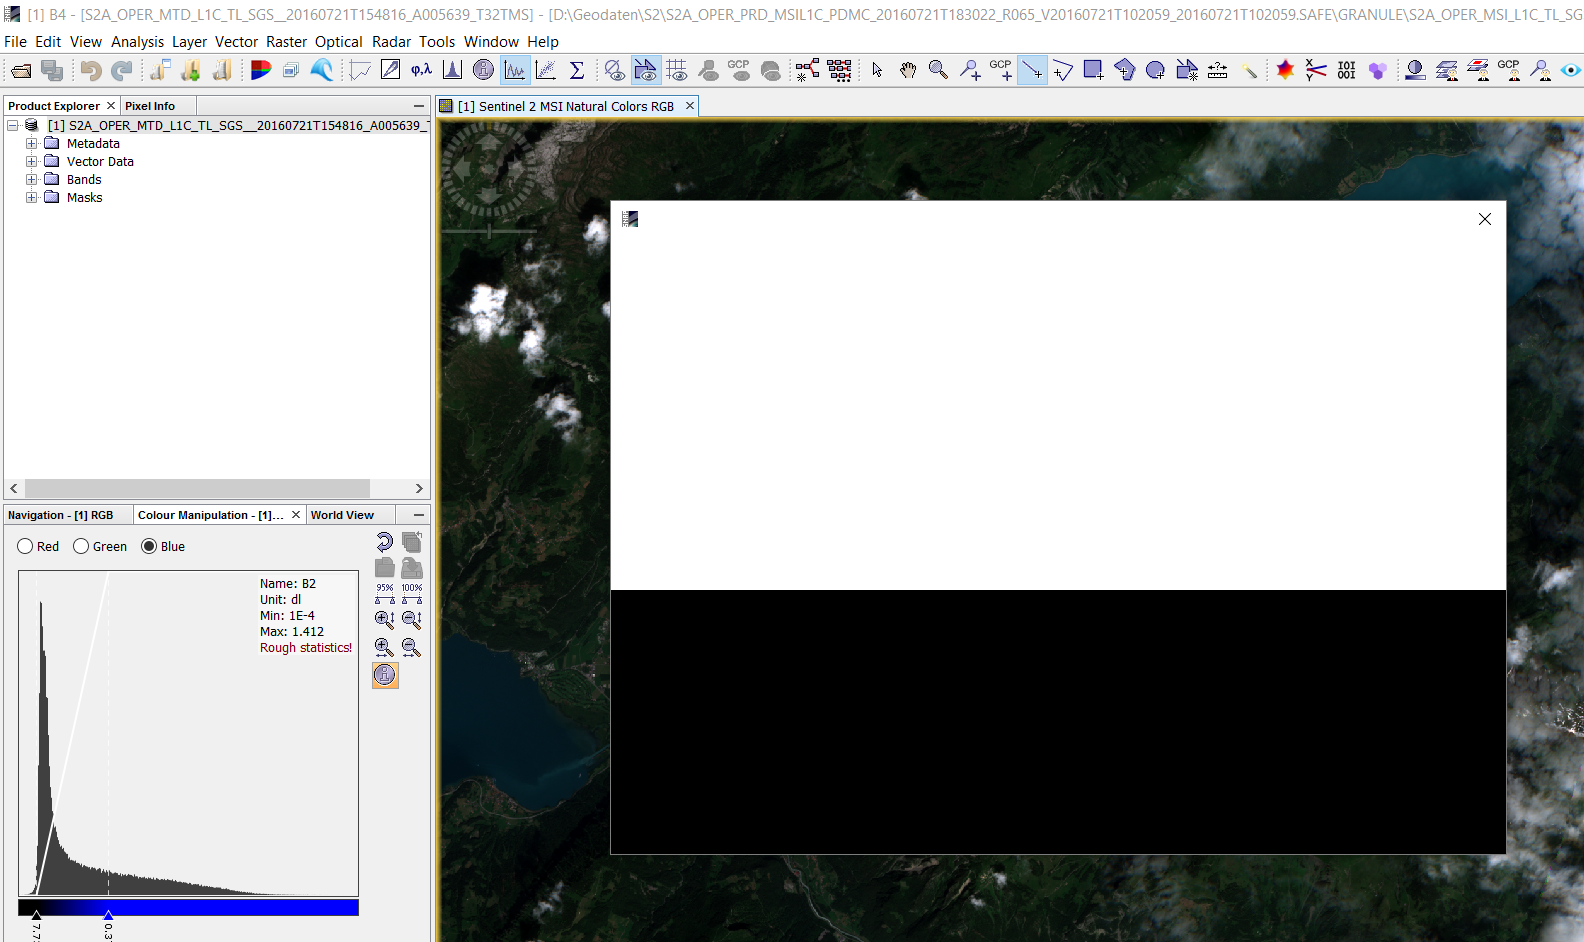
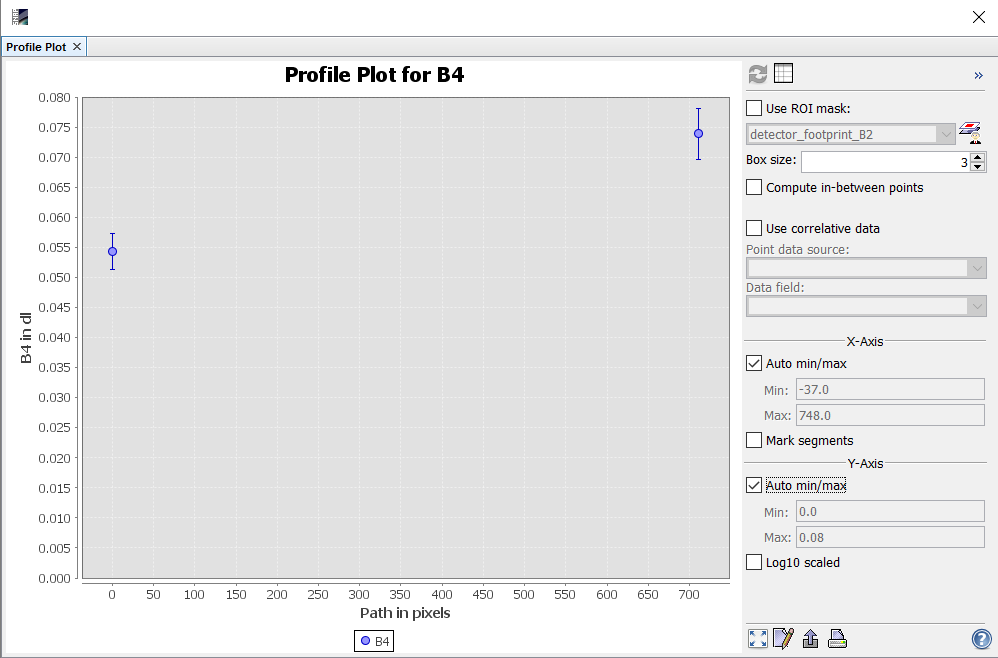
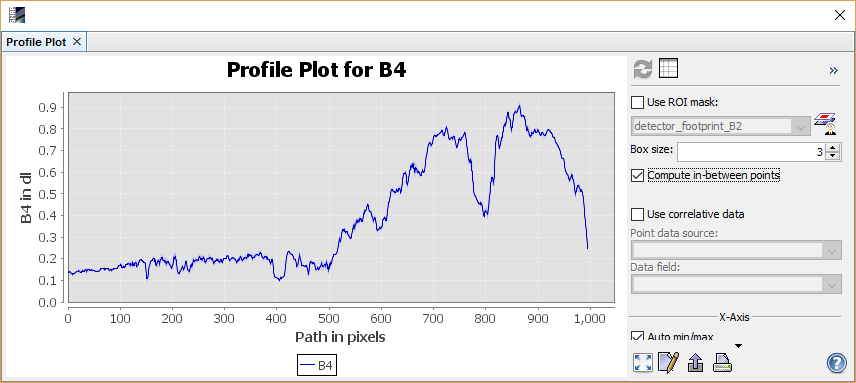
The profile plot can only show the profile of a single band not of an RGB. That’s why it chooses the red band to show.
So it is better to show profile plots only on single bands not on RGBs.