I am running snap-5.0-amd64 over linux debian ; during the processing
of a very simple graph (apply orbit, thermal noise removal,
calibration, speckle filtering, water mask and few writes) over polar
band VV of a single IW GRD S1 image (original zip file) and I could
observed the following attitude of my laptop :
RAM was around 2GB at the start of the process then it started to
grow continuously up to 13.2GB while no other task was running on
this PC ;
there never was an issue with the processing capabilities of the
PC with around 2 CPU among 16 being busy above 80% and the
others being nearly idle.
after the end of the snap processing and until I closed snap the
memory consumption remained 13.2GB …
To me this clearly indicates that there is a memory lick or in any
case a bad memory (garbage) management by snap. I can see that similar
issues have been reported for long time and I am surprised that it has
not been considered as a serious issue to be fixed, is that true ? Now
if after this I start running my graph on another S1 image then my PC
will start to make use of the swap whereas it has 16GB memory (I
could observe it) and this is a killer if you have to process a bunch
of images.
We have looked into the problem and did not find any place in the current code with memory leaking. It could be that the problem has been fixed since SNAP 5.0. The user can try SNAP 6.0 Beta to see if the problem is still there. If yes, we will look into again.
Dears, I am actually using snap-5.0-amd64 and the following screen shots will show you the actual concern when I run my graph with the Batch Processing functionality (same applies if I run the graph over a single image directly from the GraphBuilder) :
the processors are running the batch and memory consumption gets high very quickly (before running the Batch Processing memory load was 2.5 GB or To in french)
I agree, I think the memory leak is in the calibration of SAR data. ( see the topic I opened). All I am doing is calibrating S1 images in SNAP and I have the same memory issues. I now decided to program the calibration in Python to avoid using Snap…
Yes, I’ve tried. Before that the process was even unable to start, after it stops at 4/5 of the process.
Because of that I have a set of problems.
I can’t calibrate the whole image,
If I do subset to a small region, I can calibrate, but I can’t deburst. In such case Deburst shows an error about boundaries of an image.
If my image wasn’t debursted I can’t do Geometry->Range-Doppler. It demands debursted images only.
I need to make interferometry, but because of all of that issues I can’t do anything!
The issue must be somehow related to your system, as otherwise a large number of users would report they cannot calibrate. The possible memory-leak is something we are investigating.
I have a good system, but constantly have all the possible errors.
I have Java heap error (after several hours of working) when I try to do TOPS->coregistration despite I have -Xmx14308m -Xms2048m (which SNAP computed itself).
I still can’t do anything with S1 tools.
Dear Markus, dear all, it could well be that not all users need to process massive amounts of S1 images (or even do not need to process a full image at a time) and therefore do not care much to their system memory as long as they have enough and the other tasks they are doing are not impacted. I would suggest you to test the memory leak on a system that you believe to be adapted and ‘sane’.
Another approach would be to dig into the slicing approach in order to do parallel processing which I did not look at yet …
As the most unhappy guy here, I would like to recommend to make it possible to make all the operations with substetted images. Actually, I need only a small field 200x100 m, but I must proccess entire Middle East at first. It’s not a very convenient way to work.
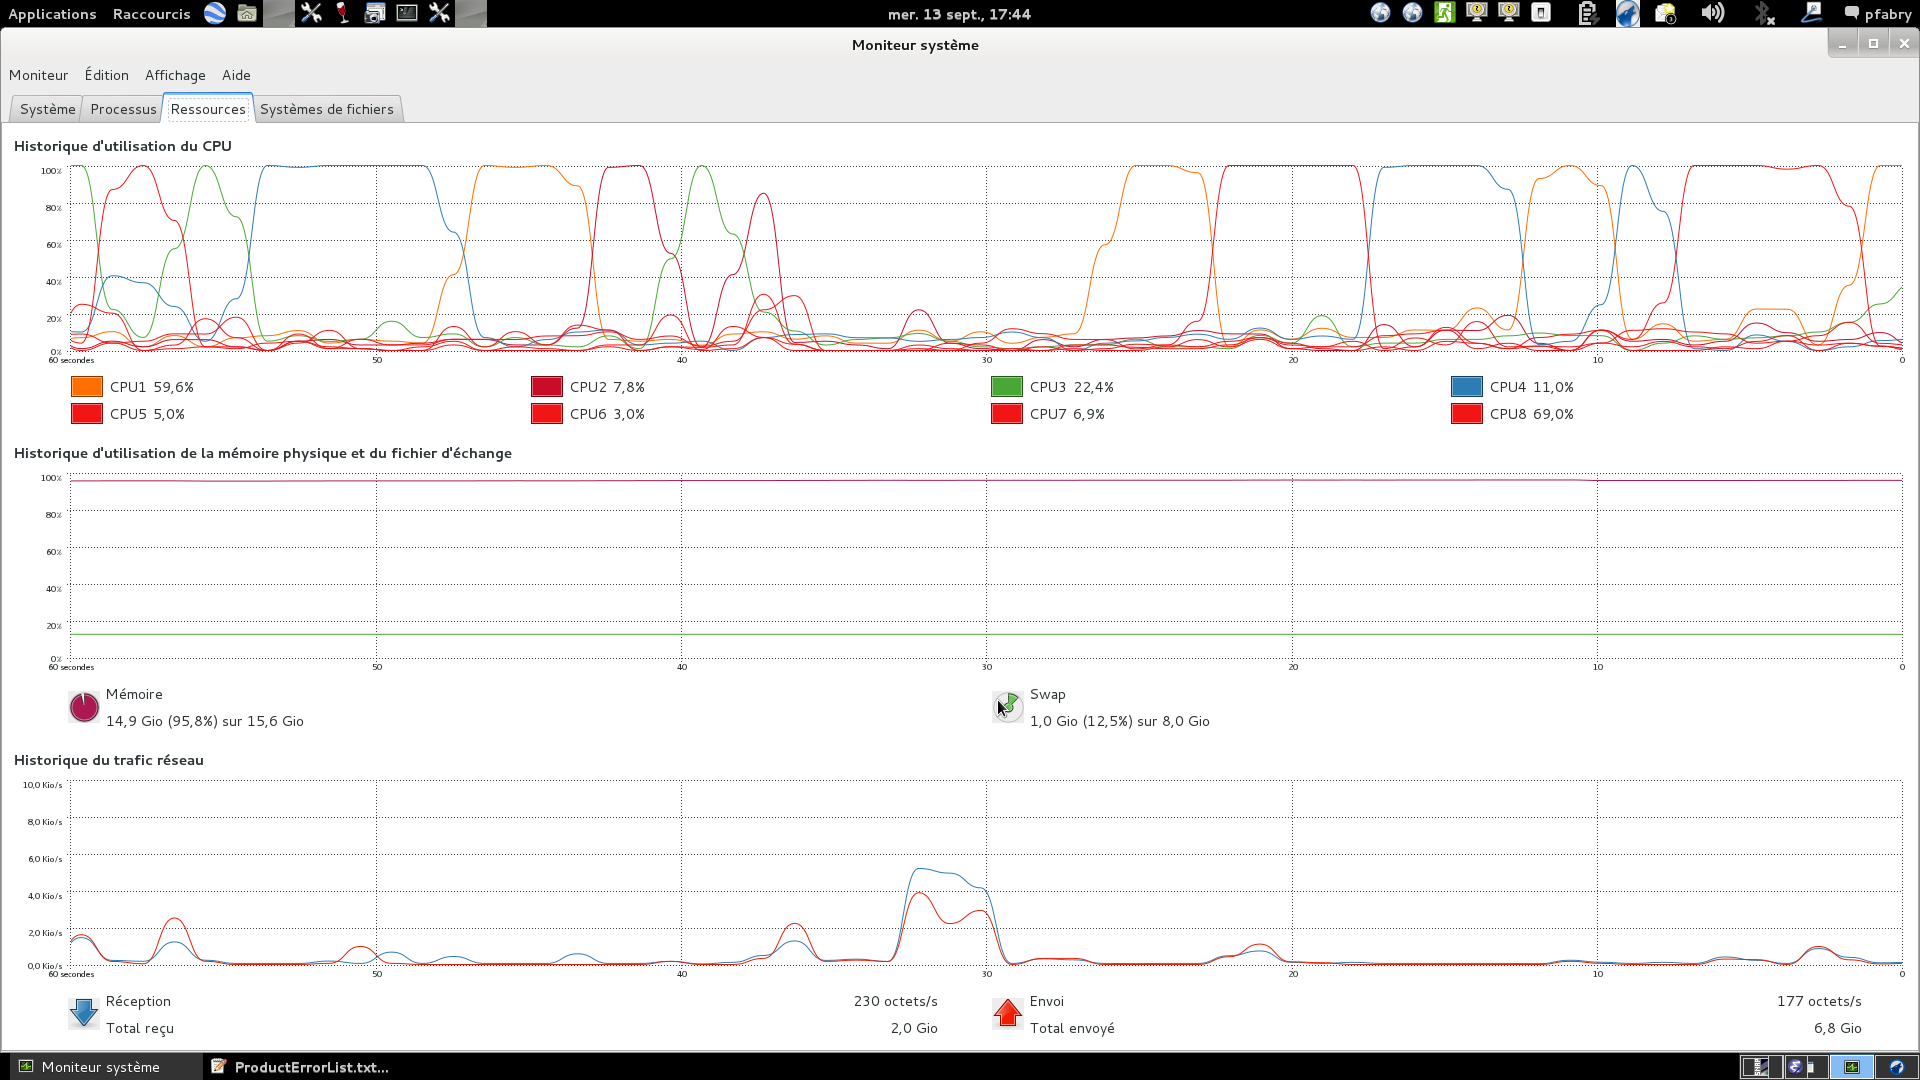
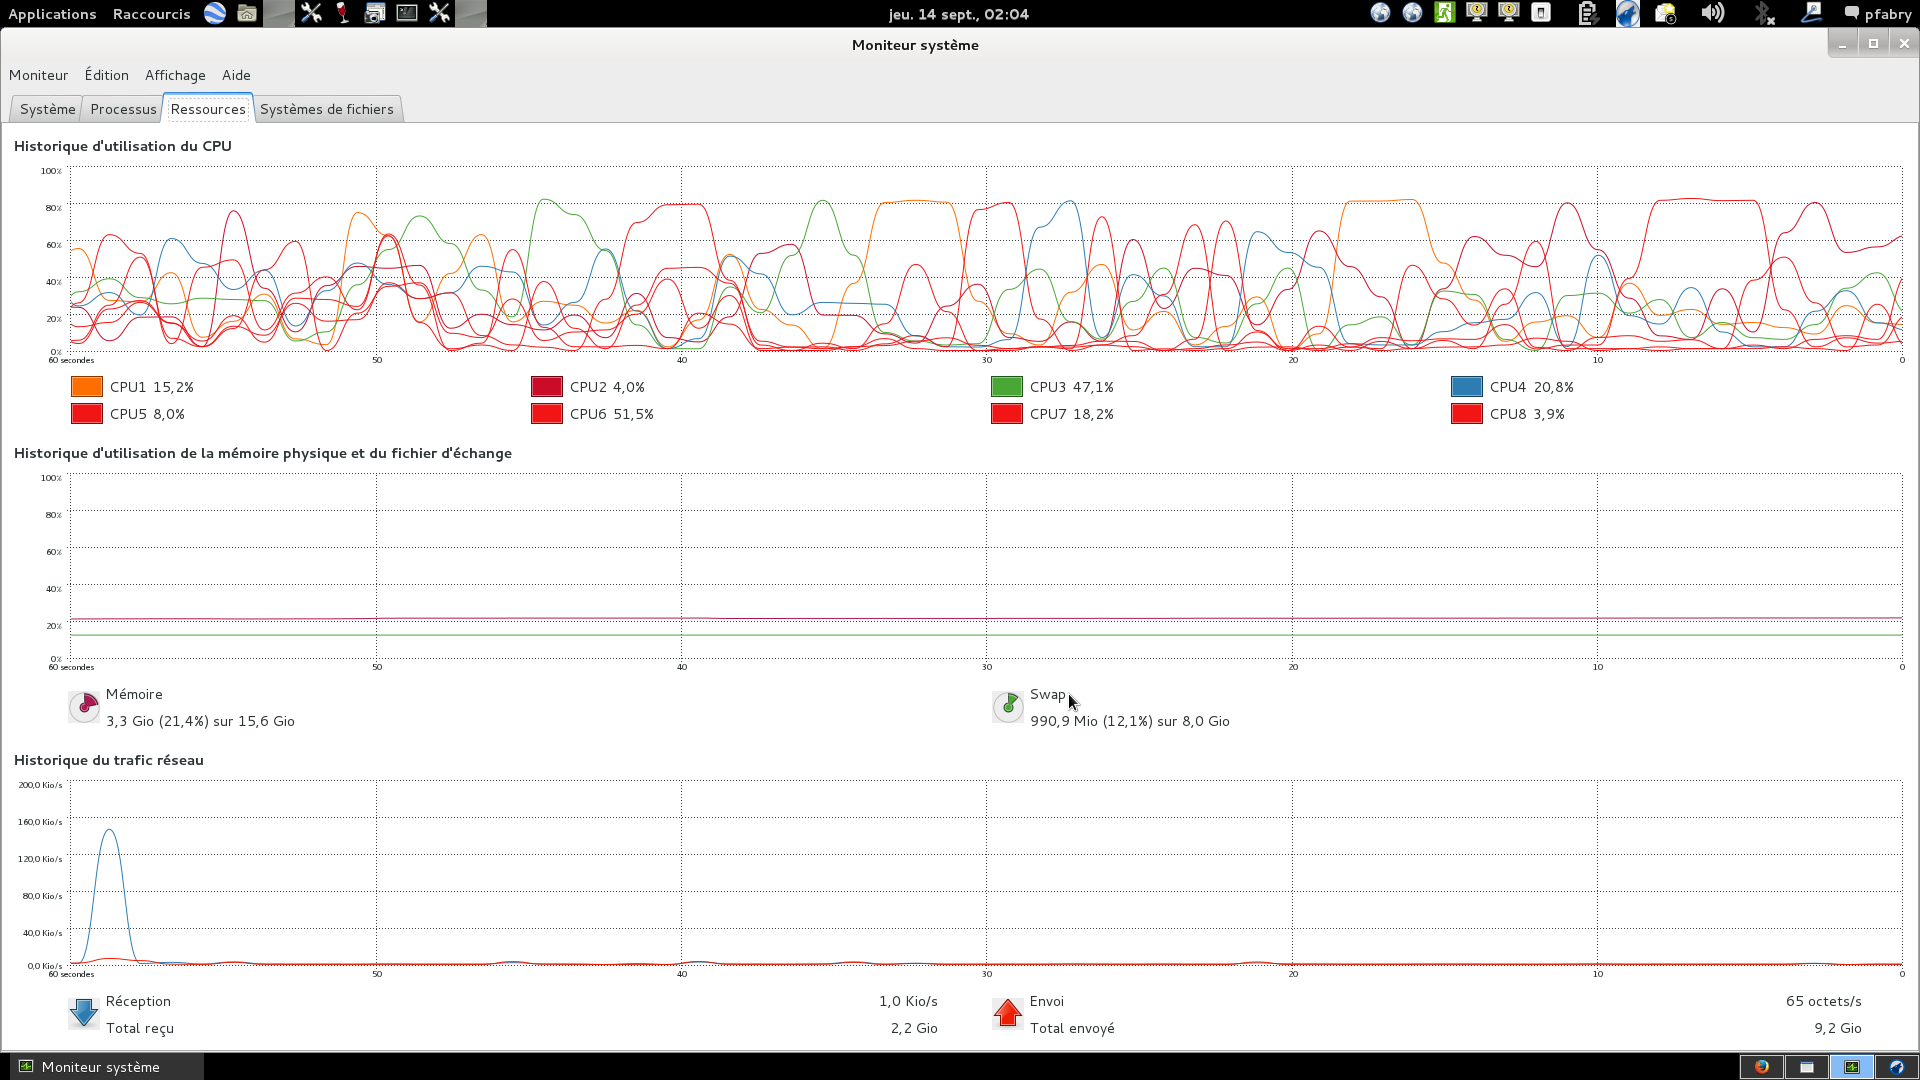
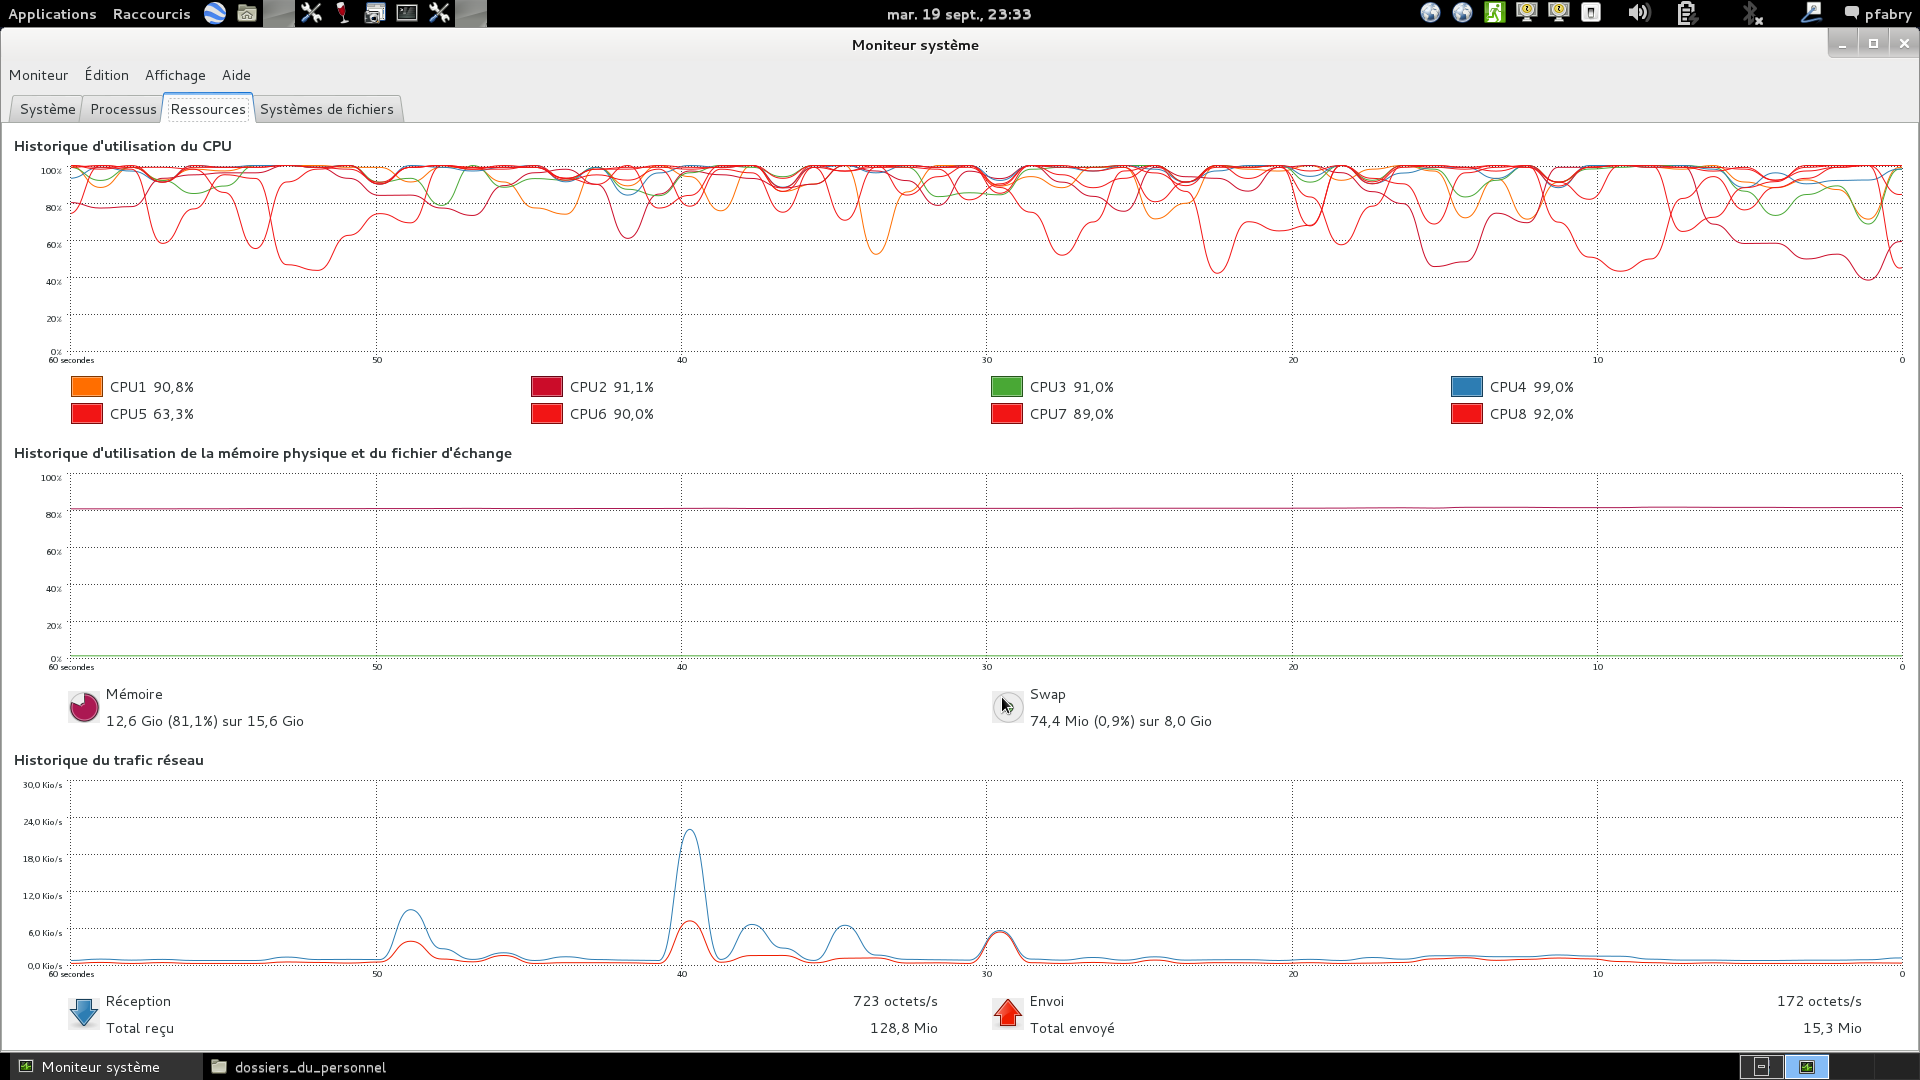
Dears, I have had a new run with an IW GRDH image and I monitored again the memory usage and other issues. here is my report : my system is an ASUS laptop with 16GB memory and a quad core i7 ; before the processing started only few apps where running : mainly thunderbird, firefox and memory usage was stable to 2.1 GB. I then started snap-5.0-amd64 and loaded the image (.zip) which brought the memory up to around 4GB. I then applied few things : Radar --> Radiometruc --> Calibrate ; Raster --> Band Math (and then remove checkbox from virtual band) and then placed the following Expression "(Sigma0_VV<5.72E-2) ? 255 : 0 ". I also did Raster --> Filtered Band --> Median 3x3 --> Closing 3x3. At this stage memory was up to 9.9 GB but i have to admit that each time I have a new band I click on it to view it. Then the worst started when I wanted to run orthorectification : Radar --> Geometric --> Terrain Correction --> Range-Doppler Terrain Correction with SRTM3Sec (Auto Download) ; DEM Resampling Method - BILINEAR_INTERPOLATION ; Image Resampling Method - NEAREST_NEIGHBOUR; Pixel Spacing - 10 m ; Map projection -
WGS84(DD) ; Output bands for : selected source bands, DEM, Latitude & Longitude (absolutely needed). =I/O Parameters --> BEAM-DIMAP. Then all 8 processors started to run heavily which looks good fur such a process over an entire image BUT Memory constently increased. At en intermediate step I took a screen shot :
later on the memory usage went above 16GB forcing 1GB swap to be used ; at this stage my system was too low to perform a screenshot, I then thought ok lets free up some 1.5 GB by closing the initial product which is not the one being processed anymore. THIS DID NOT FREE UP ANY MEMORY AND THIS IS THE REASON WHY I AM ADVOCATING FOR A MEMORY LEAKAGE … SNAP IS NOT ABLE TO FREE UP THE MEMORY TO THE OTHER TASKS ONCE IT HAS ALLOCATED MEMORY FOR READING A PRODUCT, EVEN THE CLOSE PRODUCT ACTION DOES NOTHING ON THE MEMORY !
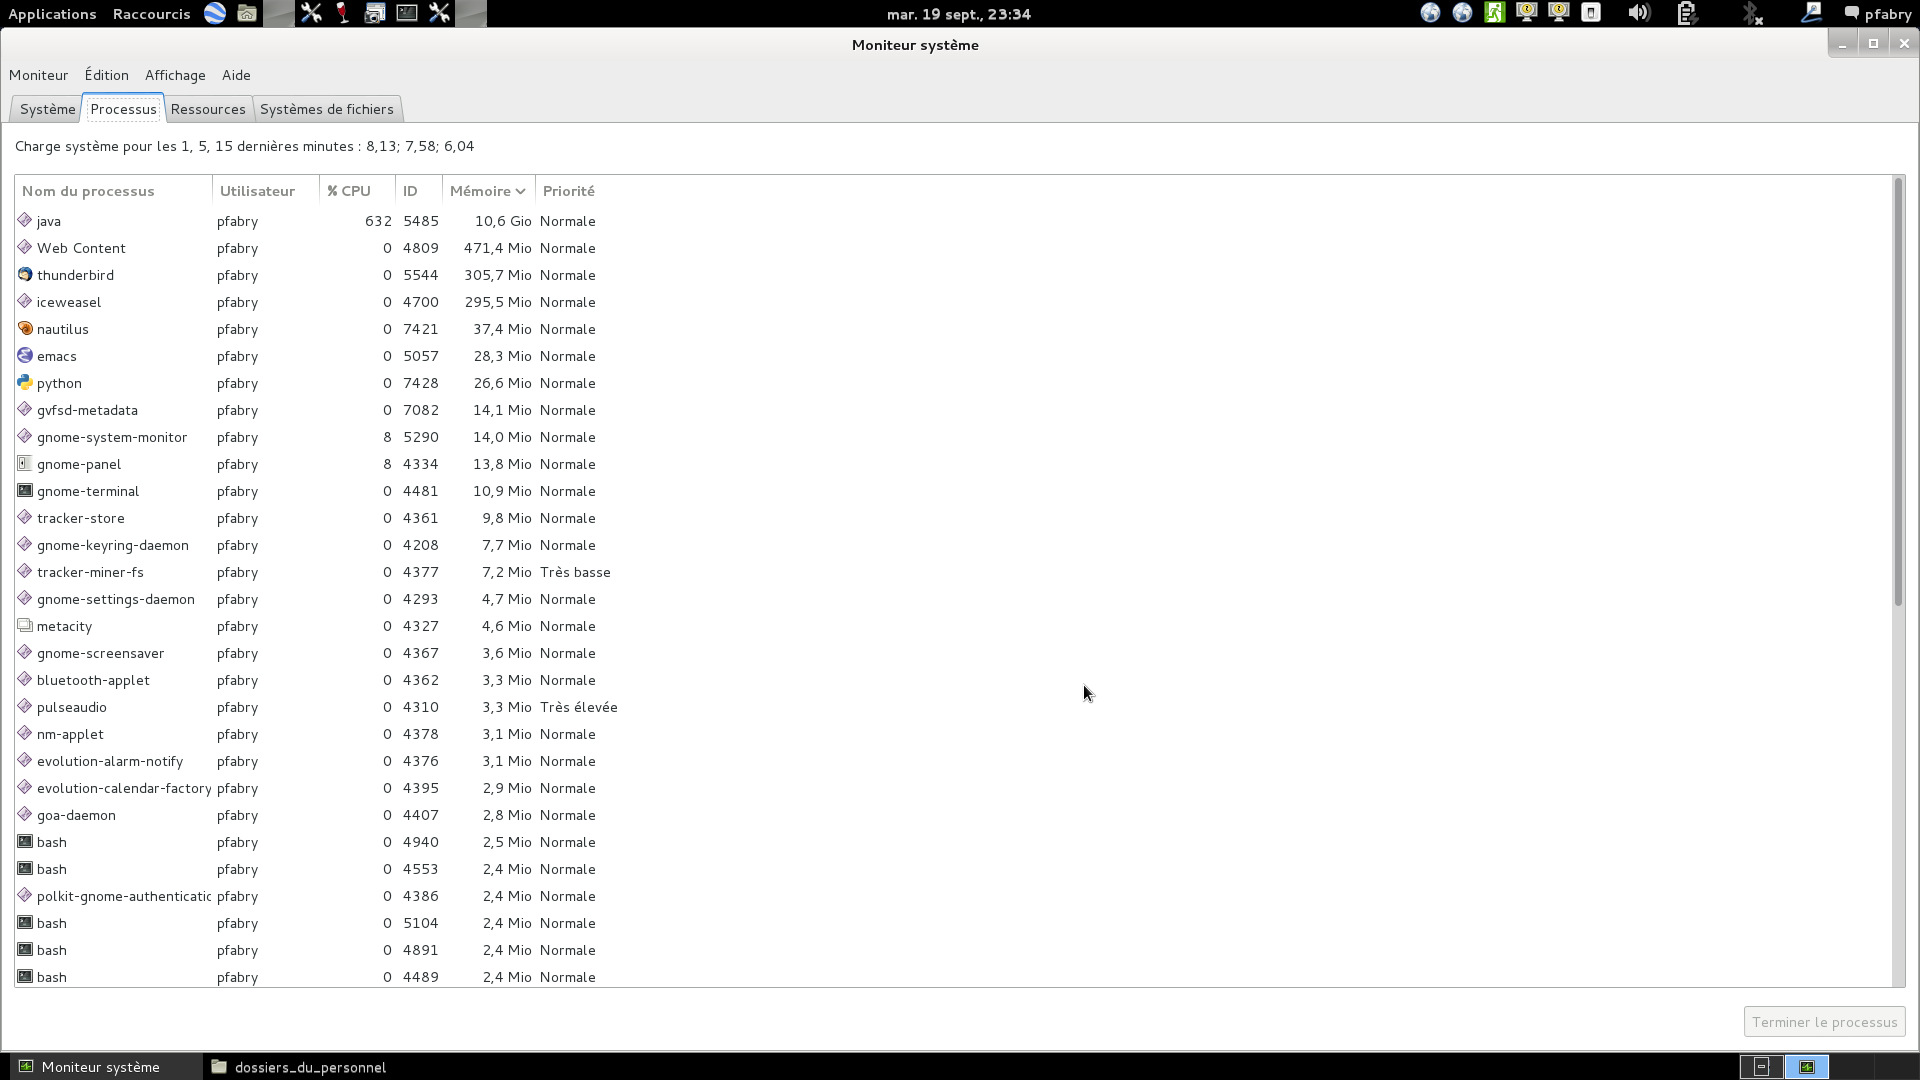
10 hours later the process was not finished and I never got the result ! I had to kill java task !!! Therefore WE FOR SURE HAVE AN ISSUE WITH MEMORY MANAGEMENT BUT we may also have an issue with the way the Range-Doppler Terrain Correction works … I would like if some of you manage to have it complete the processing of a full image and in this case what is the spec of their system ? many thanks.
I have investigated this issue. While it is true that the memory is not freed with respect to the usage observed by the OS, it is freed within the Java VM.
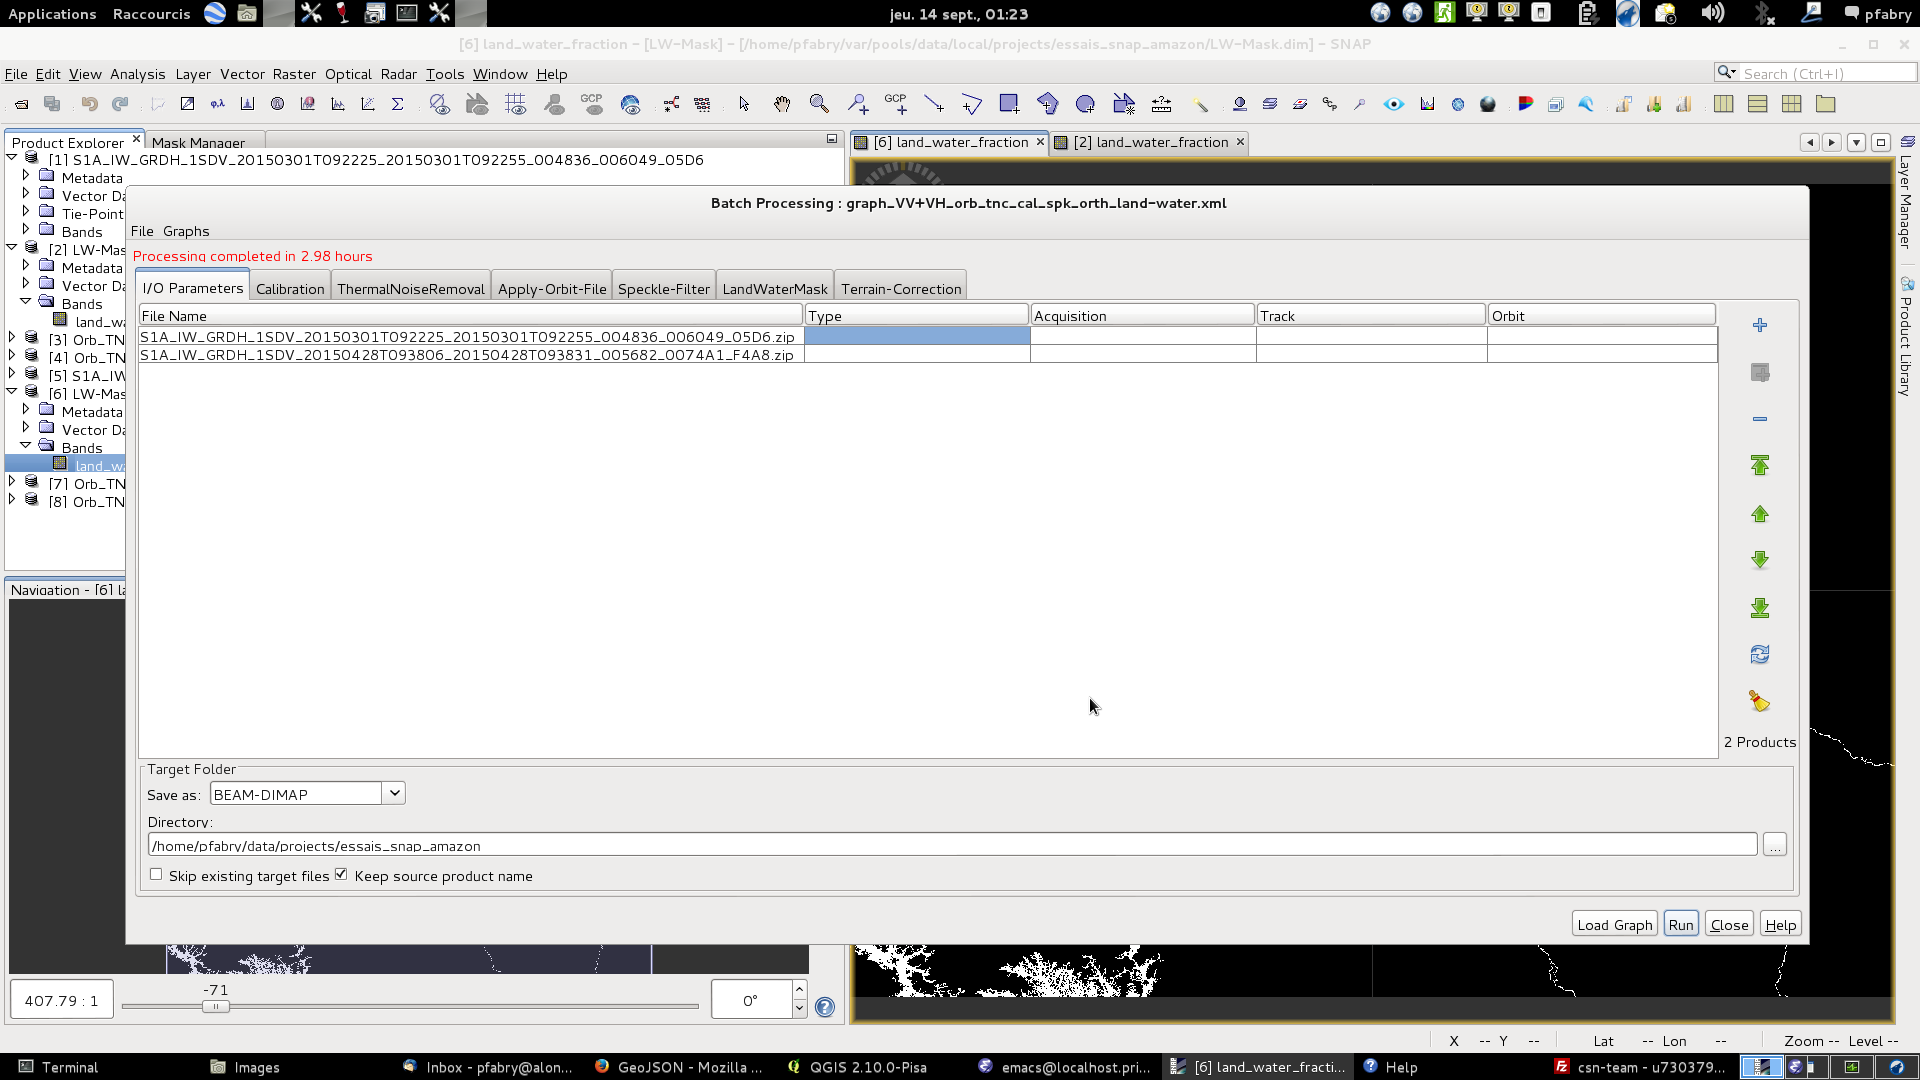
Via the GraphBuilder I was able to perform the following steps with two products one after the other. I set the heap size to 12G.
Calibration
ThermalNoiseRemoval
AppyOrbitFile
SpeckleFilter
TerrainCorrection
To understand this you need to distinguish between the heap size and the used heap.
The heap size is what is observed by the OS process monitor. This more or less only increases over the runtime of the application. There are some configuration options to influence this but might go hand in hand with other shortcomings. See also the stackoverflow discussion.
The used heap changes over time and goes up and down.
For the above-mentioned runs the numbers were (in MB) after there completion:
run | used heap | heap size
1.  | 1800      | 12000
2.  | 2000      | 12000
I must confess that I’m not very sure anymore for the values of the second run. But they were of this magnitude.
These are just rough numbers. Right after the processing was completed the used heap was actually. But after triggering the garbage collection the value decreased and memory was freed for the next processing. triggering the garbage collection actually not necessary because it is performed automatically when the amount of free memory is low.
So I think there is not a real memory leak. Except for one issue I’ve observed. The above numbers were taken when the area was a new one and the DEM data needed to be downloaded. When the DEM was already locally available the used heap went down even further to ~150MB. So there might be a smaller memory leak in the DEM handling but this should be investigated separately.
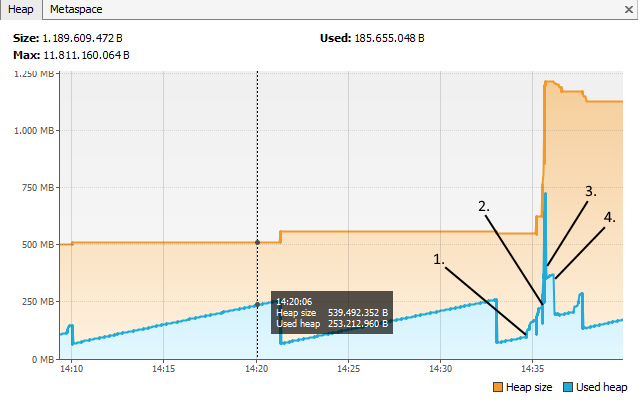
As another example, I measured the memory for another use-case.
The product has been opened
2 image views have been opened
The views are closed again
The product is closed too
As you can see, the used heap changes while the heap size only increases, except for the little decrease at the end.
So at the moment, I can’t see a huge memory leak. But I would agree that the overall memory consumption is too high for the above-used sample graph. To find out why this is happening needs more investigation. Each operation needs to be analysed. This is currently out of scope, unfortunately.
Update:
To trigger the garbage collection you can enable the performance toolbar.
Right-click on the toolbar and select Performance.
Now when you click on the graph the garbage collection is performed.
I have 32 gb memory and i7 8700k. Snap sometimes consumed over 23 gb RAM and 89% cpu usage while going through a graph to create only one interferogram out of three bursts, it to too long 1h and 29 min, perhaps because I have reinstalled SNAP and forgot to enable FileCache from S-1 but it also took only 16 minutes for exactly the same process with different S1 image pairs. Odd