SNAP for newbies

Hi,
Is there any kind of facility, or group for those who are new to SNAP and Sentinel data?
I have just started a PhD, and I have defined what I would like to do with the data, but am finding it difficult to find out how to do it. I am reasonably computer (and data) literate, but not an experienced coder, so a lot of the answers on here are very difficult to understand.
Any suggestions would be gratefully received!

there are quite many tutorials around, but it depends a bit on what you want to analyze (congratulations on starting a PhD by the way!).
So maybe we could give you concrete hints on materials, lessons, groups ect, if you tell us a bit on your aims.

Thanks @ABraun, its been an interesting few months, I started my PhD on the 17th March, and on the 18th my university went into lockdown along with the rest of the country, so accessing information from those with experience has been very difficult!
I’m trying to develop a combined catchment/hydrological model to determine the effect of different forest types on streamflow, and the issue i’m having is with the canopy side. As i want to use LAI derived from remote sensing in the model, i need to get the most accurate value possible. I know that there is a sentinel product which offers LAI at a 300m resolution with a ten day repeat, but when I plot an individual pixel’s LAI value over time it seems to be very variable.
What I would like to do is to use the raw data (as in MSI bands B4 and B8) to calculate the NDVI and then calculate the LAI from that as has already been demonstrated in the literature.
this would enable me to have an LAI value at 10m resolution, which is important in a study site which is about 5km by 6km.
However, i have just searched the Copernicus open access hub and could only find approx. 180 of the S2A_MSIL2A_ images which cover my study area, each of which is almost a Gb in size. and only goes back to 2018.
I only need about 500 by 600 of the pixels in the image, can I extract these without to much complicated coding?
I have LAI data going back to 2015, so I assume that there is raw data that was used to calculate this, but is it available?
Sorry this was a bit long winded, but you did ask :wink:
Thanks

1 Like

I see, thank you for the explanation. I can imagine that this was not the best time to start - but who could have guessed… Good that you made it so far :slight_smile:

Yes, the Level-2A products are currently being processed, but at different pace. So while some parts of the earth are already completely available, only L1C exist for large periods. Technically, you can convert every L1C product to L2A with the sen2cor software. It works best if applied via the command line to entire folders (leave the .SAFE folder as it is, please see here: Sen2Cor-02.05.05-win64 - AttributeError: 'L2A_Tables' Object has no attribute '_L2A_Tile_PVI_File')

But I agree that this is quite circumstantial when you only need such a small subset.

Not sure if that helps, but you can plot the NDVI of an area with the EO browser over time and export the temporal curve as CSV

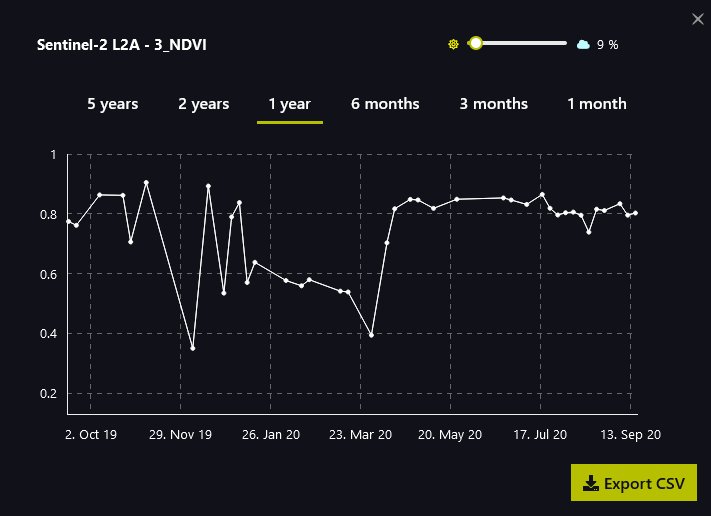
Maybe you can correlate the NDVI and LAI for a series of available L2A data (e.g. over one year) to check for robust correlation.

Sounds like an interesting and useful PhD topic. My own area of interest is in “ocean colour” (a reference to the historical observations by mariners of the wide variation in water colour", but I’m a bit concerned about your aim to get “the most accurate value possible” for LAI: LAI may not have a simple relationship to hydrological impacts, and vegetation type may be important. You may benefit from a careful review of the theory behind LAI and other vegetation indices that could lead you to a new index tailored to your requirements. Are you planning to collect in situ data for your site? If your in situ data will support it, consider recent advances in training AI to detect patterns in imagery.

I can appreciate the difficulties getting into remote sensing and data processing when many people are staying out of their labs and have added responsibilities supervising children, etc.

1 Like

Thanks @ABraun, so to get a historical record of MIS bands B$ and B8, I’d need to use both L-2A and L-1C, having converted the L-1C to L-2A?
Is there a method to extract a specific area using the cordinates? i can do this with the Copernicus Global Land Surface browser at: https://land.copernicus.vgt.vito.be/PDF/portal/Application.html…, but this is only 300m resolution.
Anyway, it all seems moot now, SNAP just told me to update, so i did, and now when I open it i get this screen-- i cant open anything or do anything!

something must have failed during the update. If nothing helps, you can completely uninstall SNAP and reinstall again.

Yes, to have NDVI based on calibrated bottom of atmosphere reflectance (L2A), you need to download L1C data. If the data is available as L2A already, you are ready to go.

@gnwiii I agree that LAI will not have a simple relationship to the hydrological cycle, but is it important in the development of the canopy model as it is a key factor in interception values, which in turn are a factor in measuring throughfall of precipitation. we will be collecting throughfall and total precipitation data at the site, unfortunately it is not feasible to collect LAI data due to budget and manpower constraints, hence the need for accurate LAI remote observations. The temporal variation in LAI in a deciduous woodland compared with the much lower variation in Evergreen woodland is likely to be a key factor within the model.

LAI is not at all accurate, particularly if you use a version intended for use at global scales and across different sensors (optical sensors degrade over time and the satellites have design lifetimes of 5–10 years). To understand the accuracy it is useful to look at comparisons between different sensors. You may be better off developing a throughfall index that is more directly related to hydrology and your in situ measurements. You can always look at how well LAI predicts throughfall – perhaps it will be good enough.

I agree with what you say about LAI George, but I think we might have our wires crossed about the purpose of my study. I am looking at whether different types of forest affect the potential flood risk of an area. To do this I need to develop a canopy interception model. This model will then be tied into a hydrological model. To develop the canopy model LAI is an integral component if I am going to use remote sensing data. Unfortunately the best resolution available ‘off the shelf’ is 300m pixels (sentinel LAI product) which is too coarse for my study area, where 300m can encompass roads, felled areas and considerable variation in tree cover. If I can calculate a reliable NDVI value (possibly even at 10m pixel scale) I can then calculate LAI from that (by using factors for the vegetative type from literature, and ground truthing the factors by observation and historical aerial photography) this will allow me to calibrate and validate the model.