Hi. I need to export the results of subsetting and applying sen2res to Sentinel-2 2A level images. The resulting pansharpened images have to be read in R (creating a raster stack of the bands of each image). My problem is that I dont find the way of exporting the images into a format that has the actual bands like the file you download from Copenicus, which has the bands files in format .jp2.
I often use NetCDF4-CF format images (mostly MODIS and VIIRS ocean colour imagery from NASA OCSSW software, but SNAP/SeaDAS exports also work). I have been converting my R software to terra from the old raster library. NetCDF4-CF is now widely supported by GIS packages and supports comprehensive metadata, often including the processing history, so reduce the manual effort needed to document processing steps for data users.
Thanks for the response. Yes, “terra” library is what I use now too.
I tried exporting the results of a very small area with the extension you suggested but the resulting product is plotted in RGB, the colors seem odd (see image). The upper image corresponds to the RGB image of the original file and the bottom one to the resampled product.
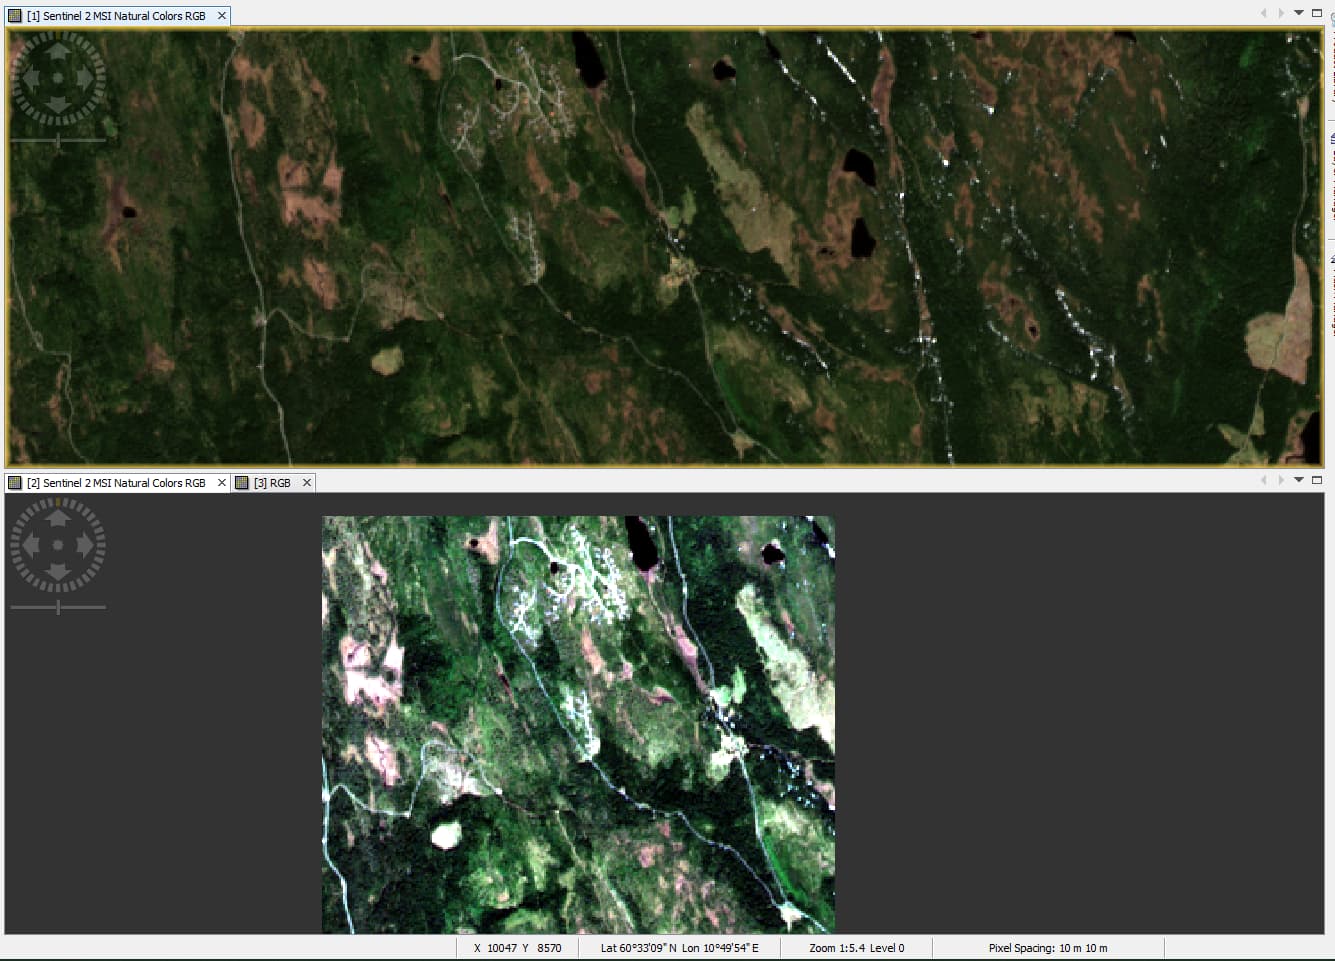
Also, when I read the product in R with terra, it does not read the extent or the resolution. Is this the case for you and you know what causes the problem? Beside, the color difference is maintained also when plotted in R.
I tried to export the result with the format “GDAL-GTiff-WRITER” and it does recognize extent and resolution. Color difference also maintained.
I don’t have problems with extents or resolution in terra. SNAP should be able to load the NetCDF4-CF file and confirm that extent and resolution made it into the file. NASA Panoply is also useful for quickly checking NetCDF4-CF files, and should tell you if there is a problem with the saved NetCDF4-CF file. Terra and the netcdf tools in R have been the subject of intensive development work. I’m using R-4.2.1 with:
Package: terra
Type: Package
Title: Spatial Data Analysis
Version: 1.6-7
Date: 2022-08-07
Pixels that were moderately bright/dark in the ROI are brighter/darker in the resampled image. This indicates that colour shift is due to differences in the range of values for each band. You can easily check that. The geophysical variables I use have a global “standard” range and false colour pallet. With terra I set values outside the standard range to NA and chose a colour pallet similar to the standard (I do need to figure out how to use the standard pallet with terra).
[Edit: added URL for Panoply]
Did you find the response you were looking for? I’m curious if you managed to solve it
Hi, I ended up reading the jp2 band files directly with terra. It works. You need to know that the values read in R are higher than in SNAP. Take a look at this