please follow these steps,

yes good.
Now save the file
and run this below command
source .bashrc
Then check your command mt_prep_snap
2 Likes
thanks a lot!!! ,it runs successfully
Dear suribabu,
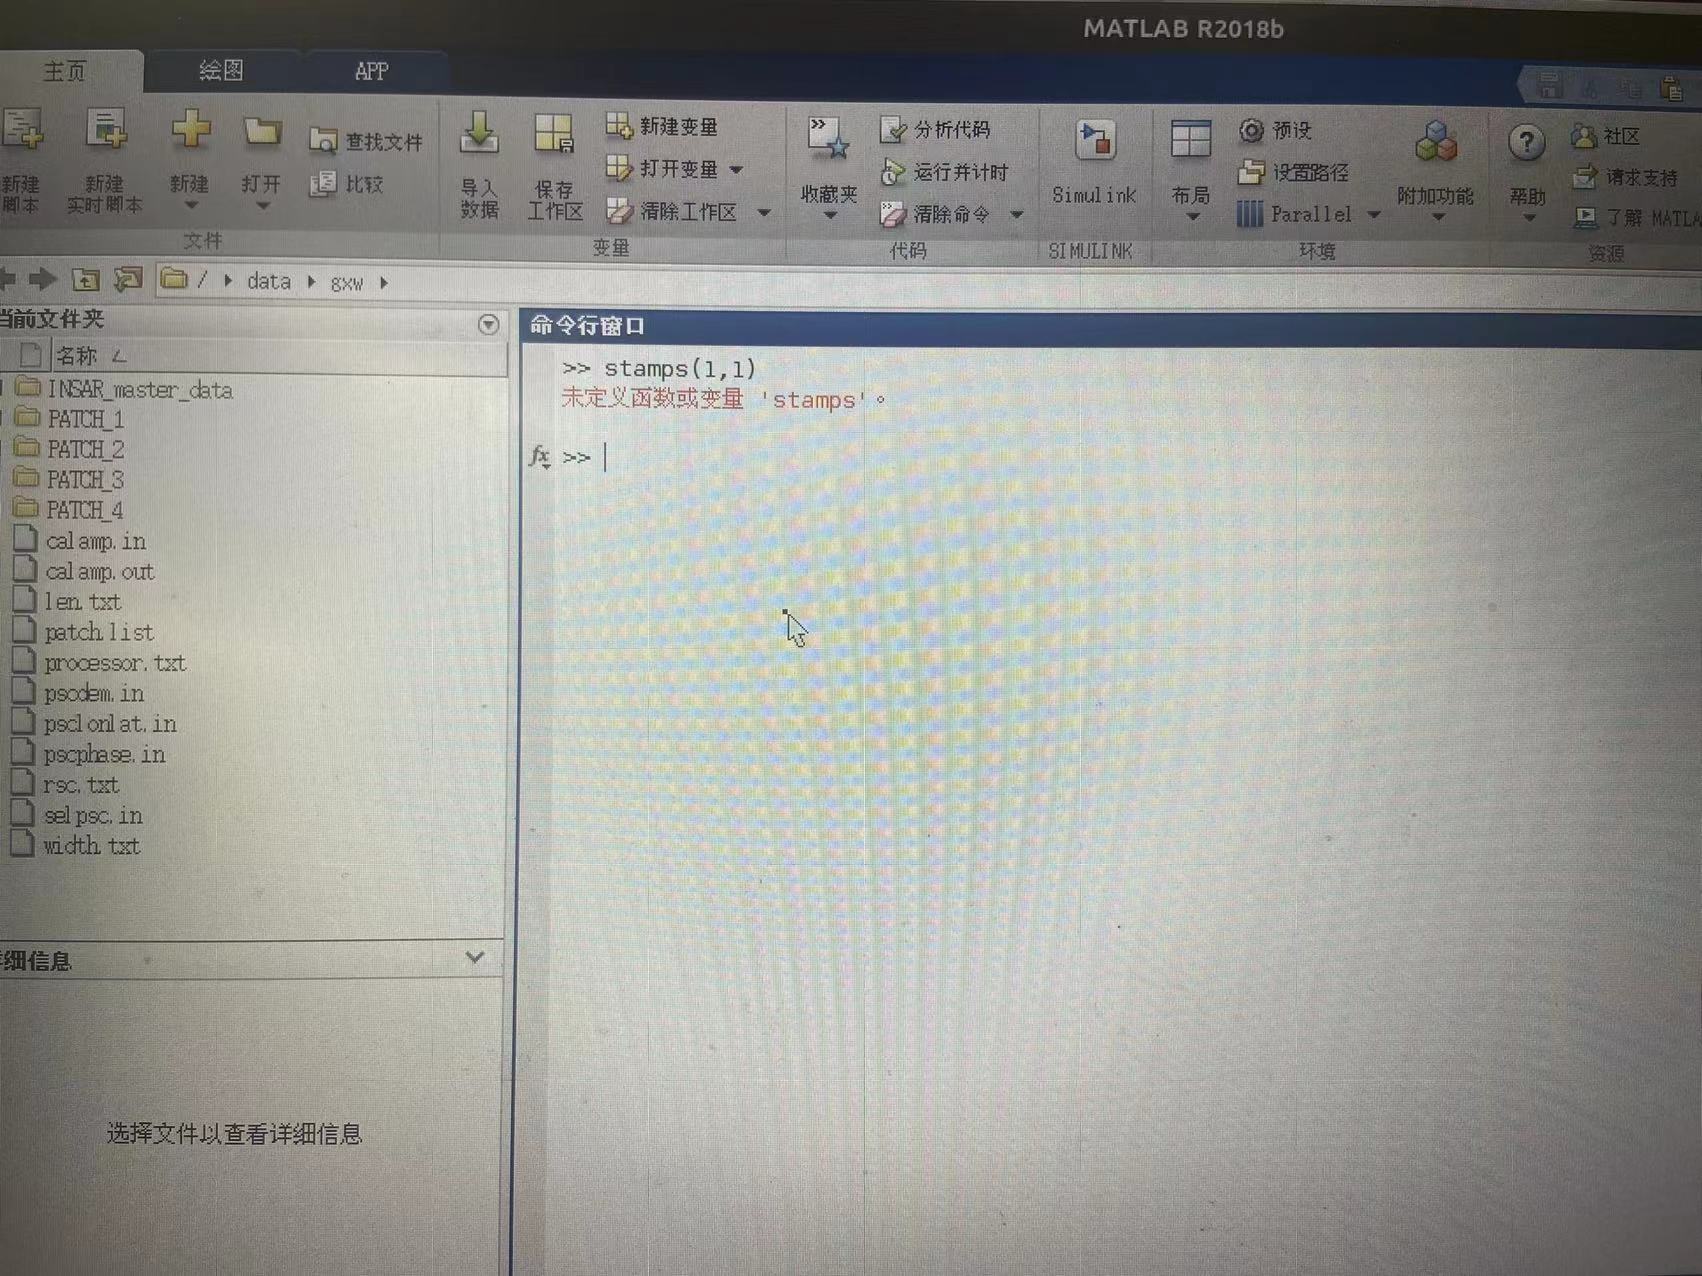
I’m so sorry to bother you again,I find a new problem. I load matlab in my INSAR_master_data directories,and then I typed ‘stamps’ in the command window,but it shows “No function or variable is defined”,I wonder if there is something wrong with the path of matlab, do I need to reconfigure the path under the .bashrc file as yesterday
Please add the StaMPS path in Matlab, using below commands
click on setpath in matlab,
Then select the Add subdirectories, In this select the stamps folder
save
2 Likes
thanks a lot
Hi @ABraun
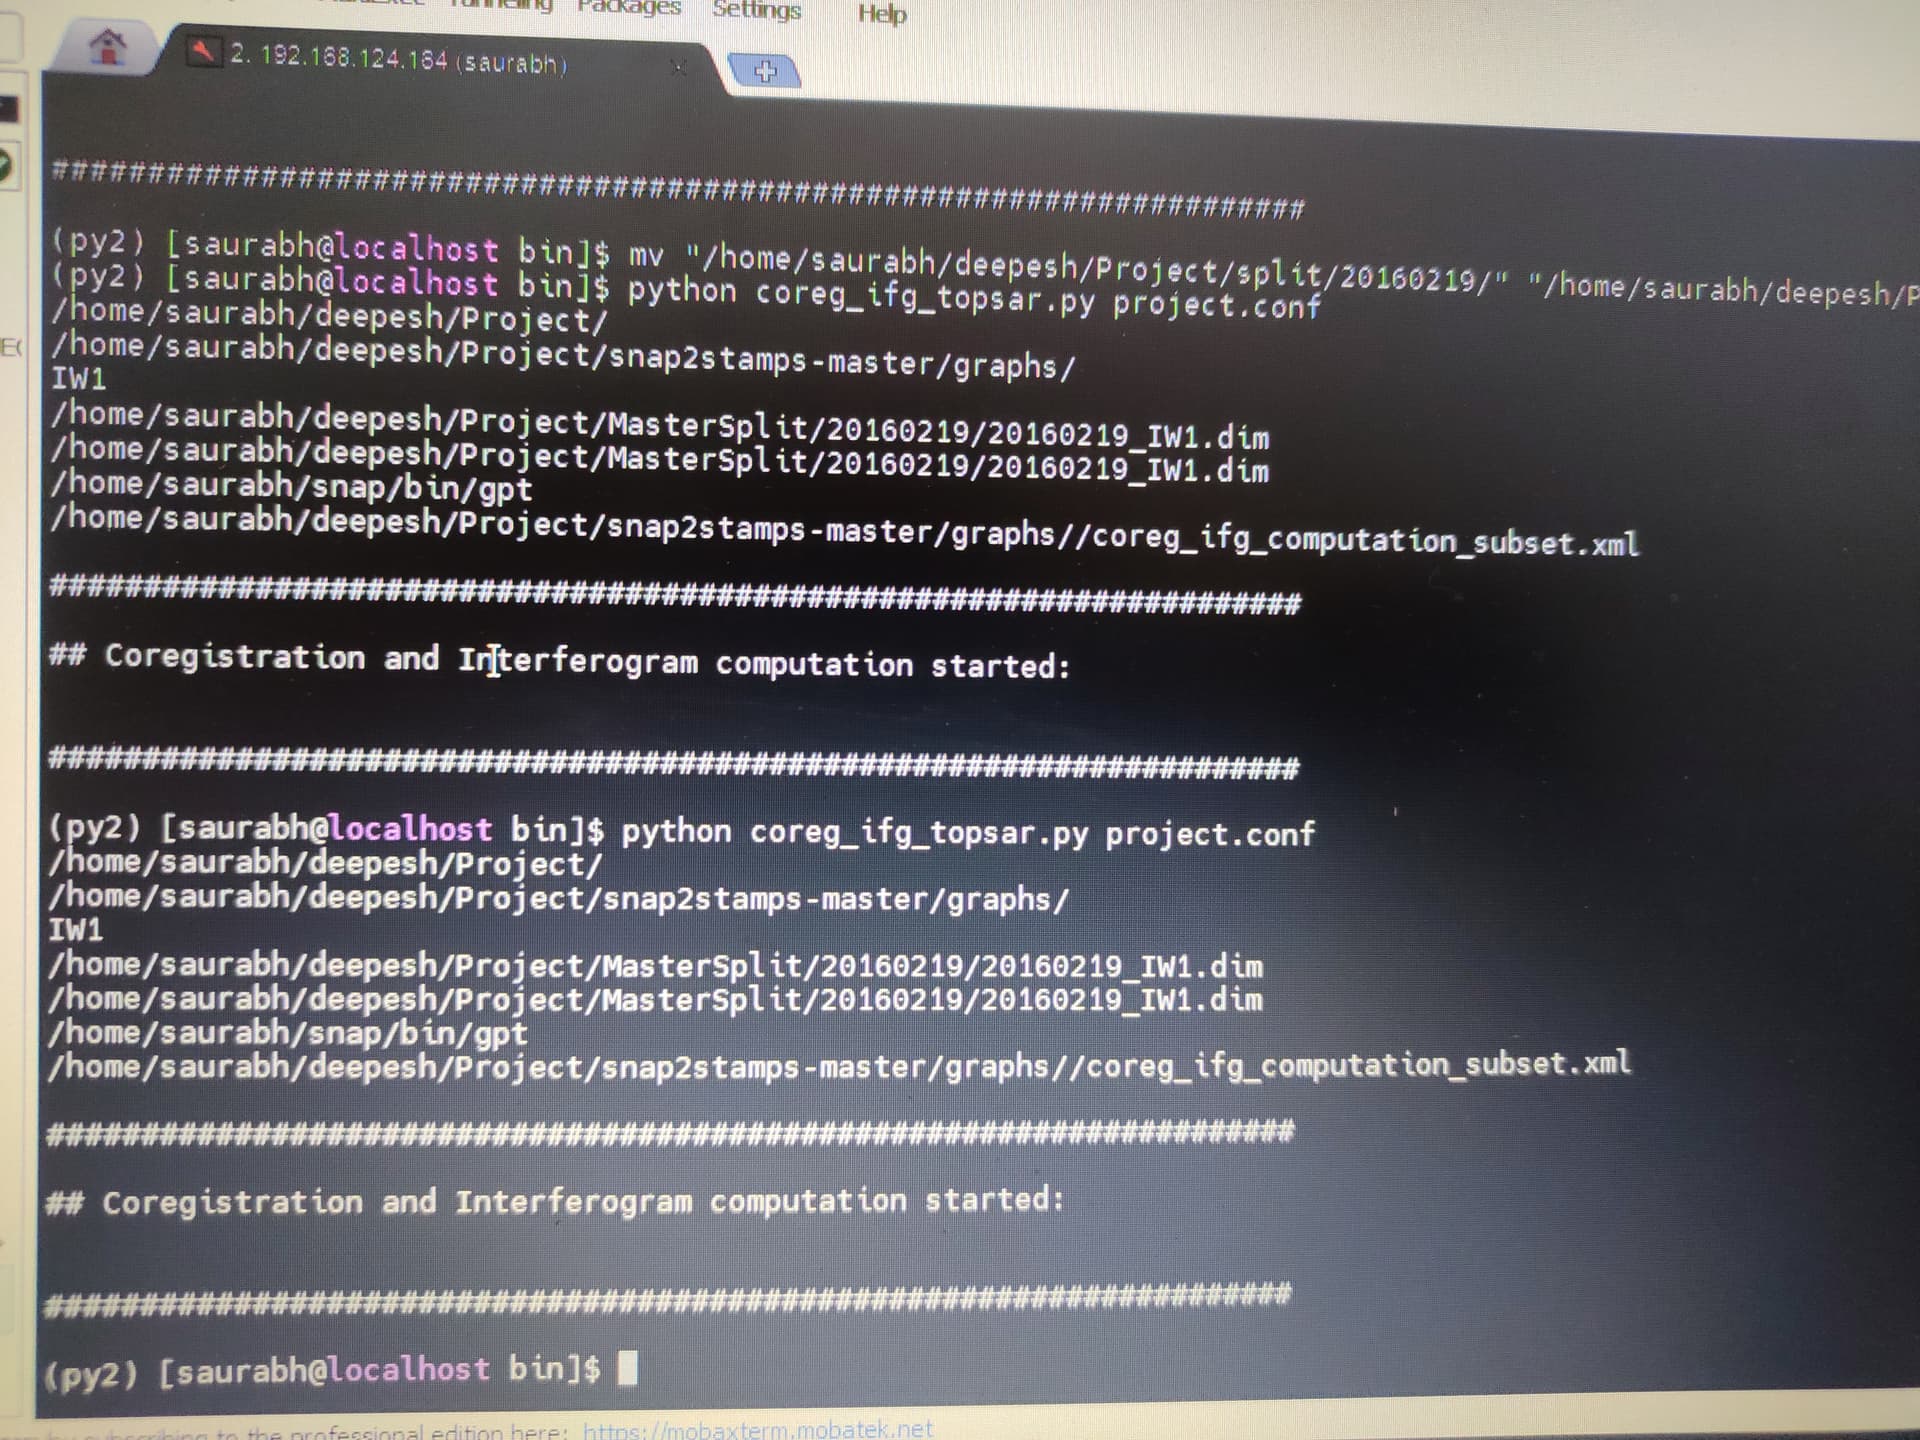
Can you please help me. I’m running coreg_ifg_topsar file
It is not processing anything, processing starts and then in a second it stops without any result
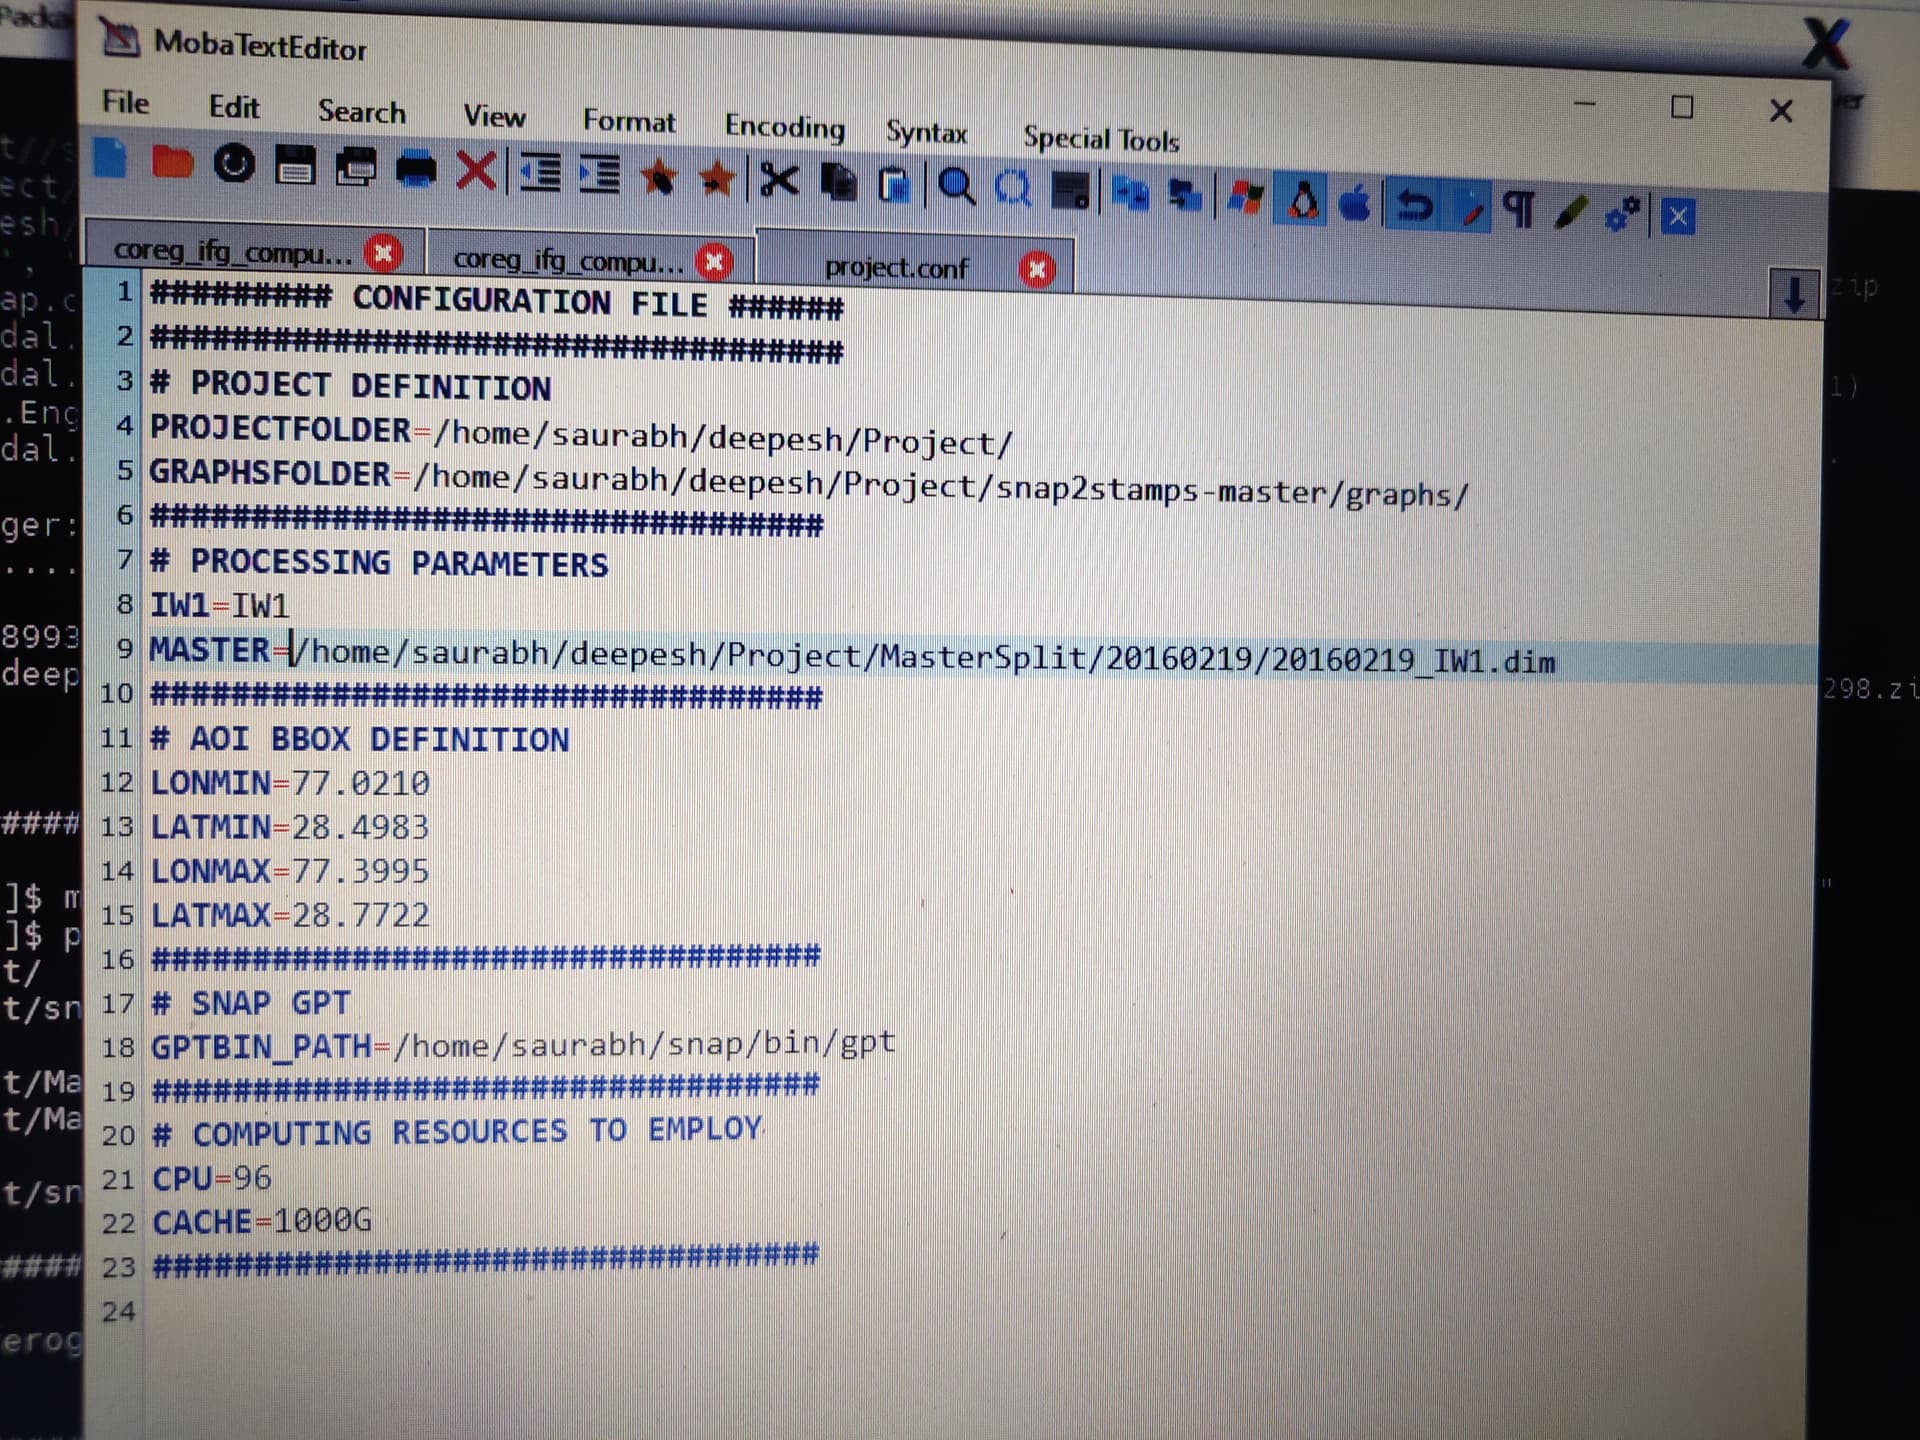
I think the script needs the master image file to end with _Split_Orb.dim
And one more thing just use python2 instead of python
If both are installed, yes.
python is okay. as im in python 2 environment only.
but coreg_ifg_topsar is giving me some problems
i was trying master split as one of the slave images. as splitting slave and preparing slave files works good for that.
now i’m using manually split master. which includes only three bursts(required area is within them)
it is giving me this error

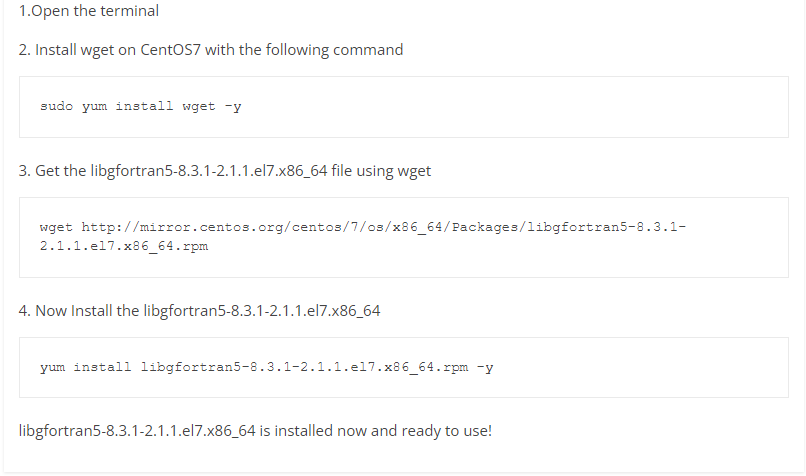
Try to install these below one, then check it.
sudo apt-get update
sudo apt install libgfortran5
2 Likes
is this the only way to install it? like i wont be able to do anything in sudoers file. i dont have the access to that.
Then it’s very difficult.
hi again
i tried installing these
first of all i found-out that on my system (that is red hat) ‘yum’ works to install things
and then i tried to find out how to install this on my system
i found something and tried this from root
but it didn’t work
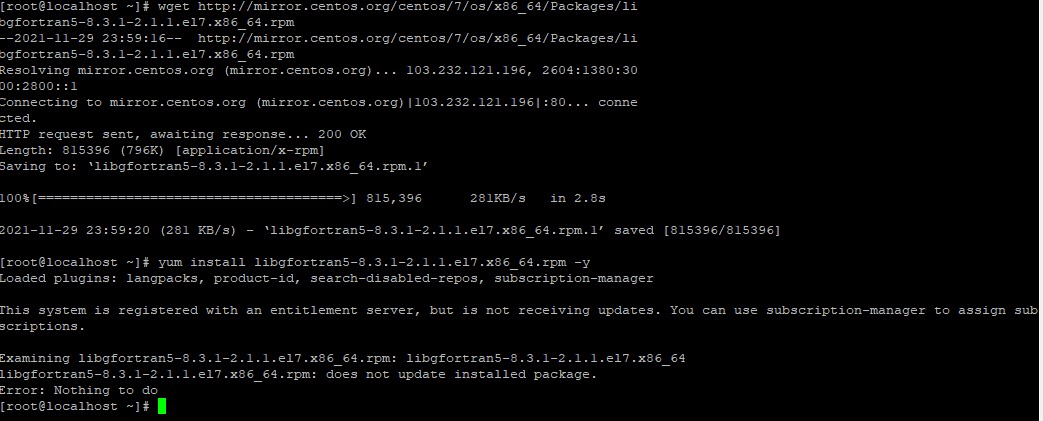
can you please help me. my system is redhat linux
sorry, I’m not familiar with Redhat Linux. Someone in this forum will definitely help you.
1 Like
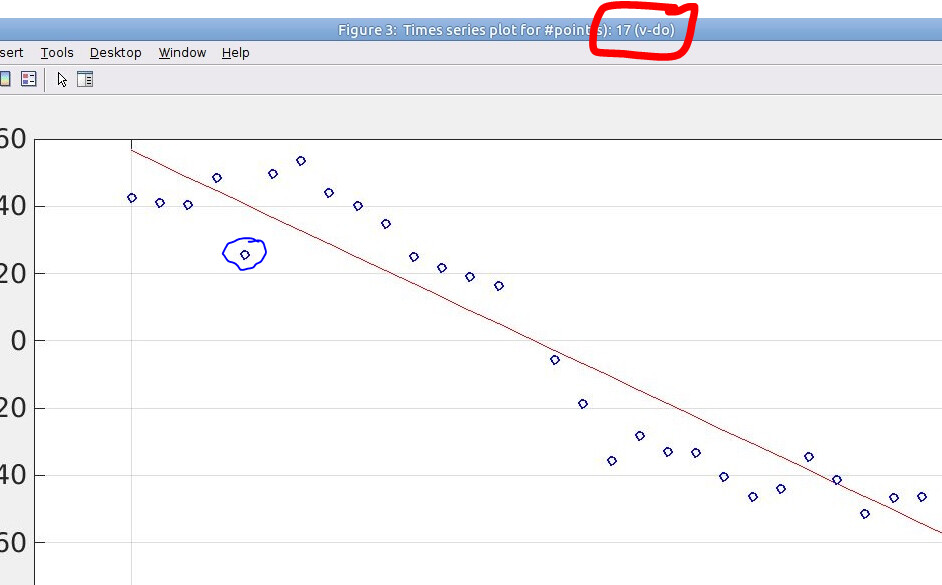
hi dear @ABraun ,Excuse me, what are the 17 PSs here?Are there 17 points above the trend line? I think there are 16? I do not know what you mean? And what are the 5th points? Can you please specify them for me in this screenshot above? Thanks
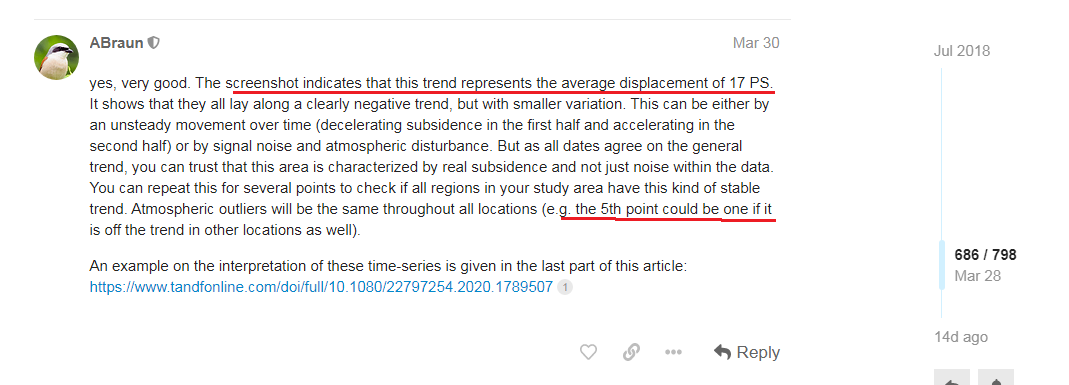
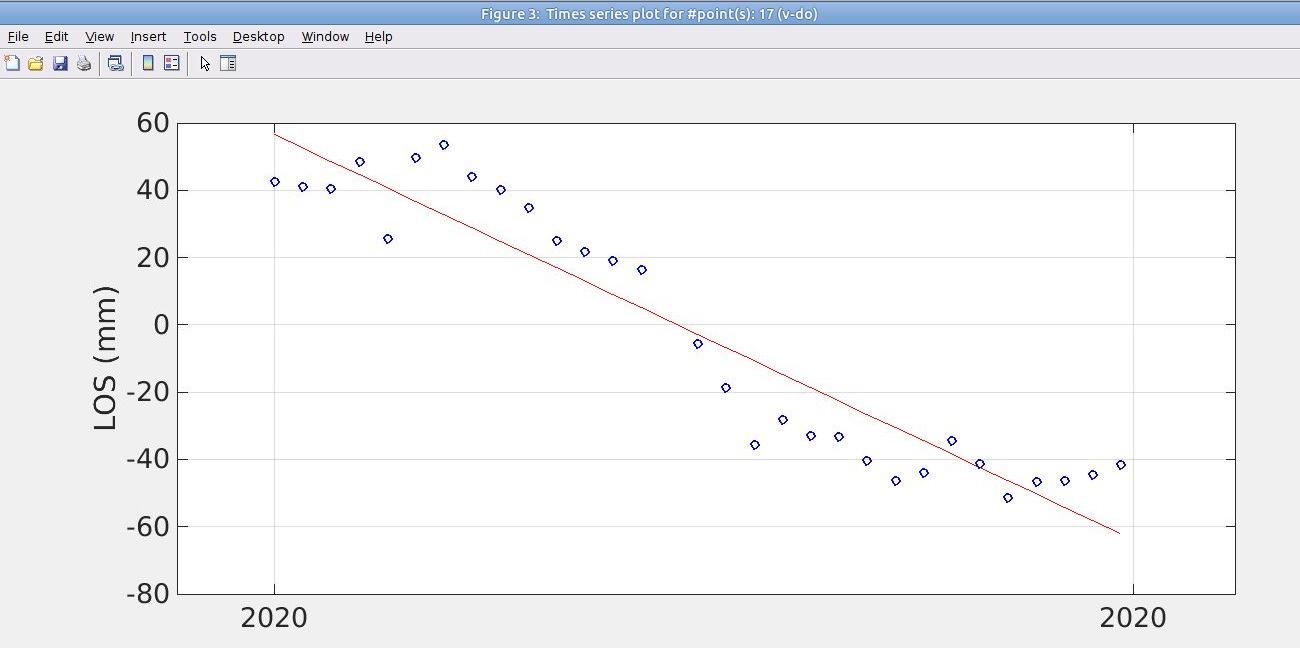
It’s important to understand that these points represent interferograms. But as the plot can not display the spatial displacement patterns over time, it just shows the displacement (y) of a small region per date (x).
That means, based on the radius selected in Matlab (ps_plot with ‘ts’), 17 PS were located inside this radius of the cursor and their temporal displacement was averaged per date.
The 5th date could (blue circle) could have been impacted by atmospheric disturbance (rainfall during the acquisition of the image) and therefore doesn’t follow this trend.