You have posted to a “solved” thread, so others are unlikely to see your post. Please start a new thread.
Please provide enough detail to allow someone to reproduce the problem (OS and SNAP versions, input filenames, etc. ) as searchable text (avoid use of screen captures as the messages are not found in searches, so others with the same problem won’t find your post. See ESA STEP forum FAQ.
I would agree in general - in this case there was no initial question in the topic and it has ever since been used for general discussions. So I’d say, instead of creating a new topic, the inquiry fits in here.
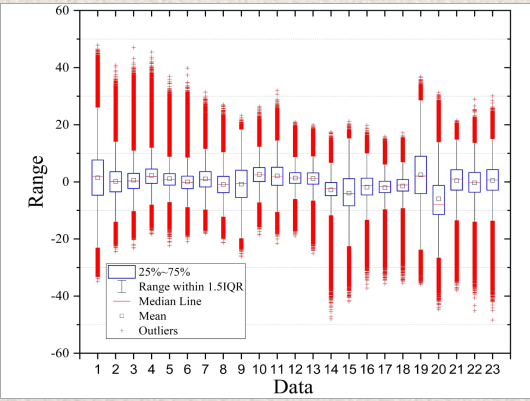
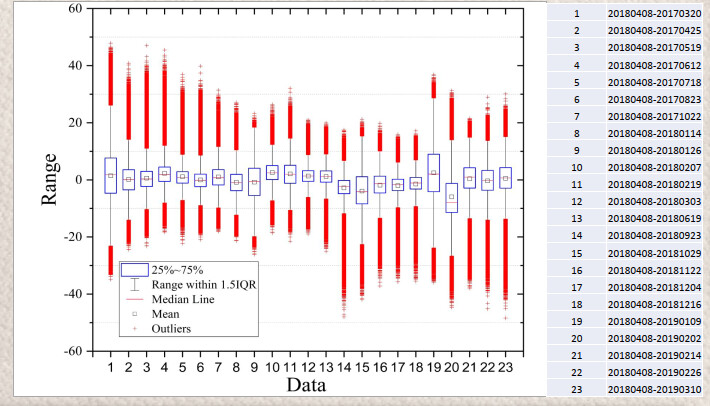
What do the numbers mean? What is Range?
If you want to create a graph like this please first help us understand what it shows. Like this, it could mean anything, because such box plots are used for all kinds of data.
@xwguo
Dear Xwguo,
Just edit .bashrc file and add path of StaMPS up to bin folder. like below
export PATH=path up to bin folder:$PATH
then type, source .bashrc
Dear suribabu:
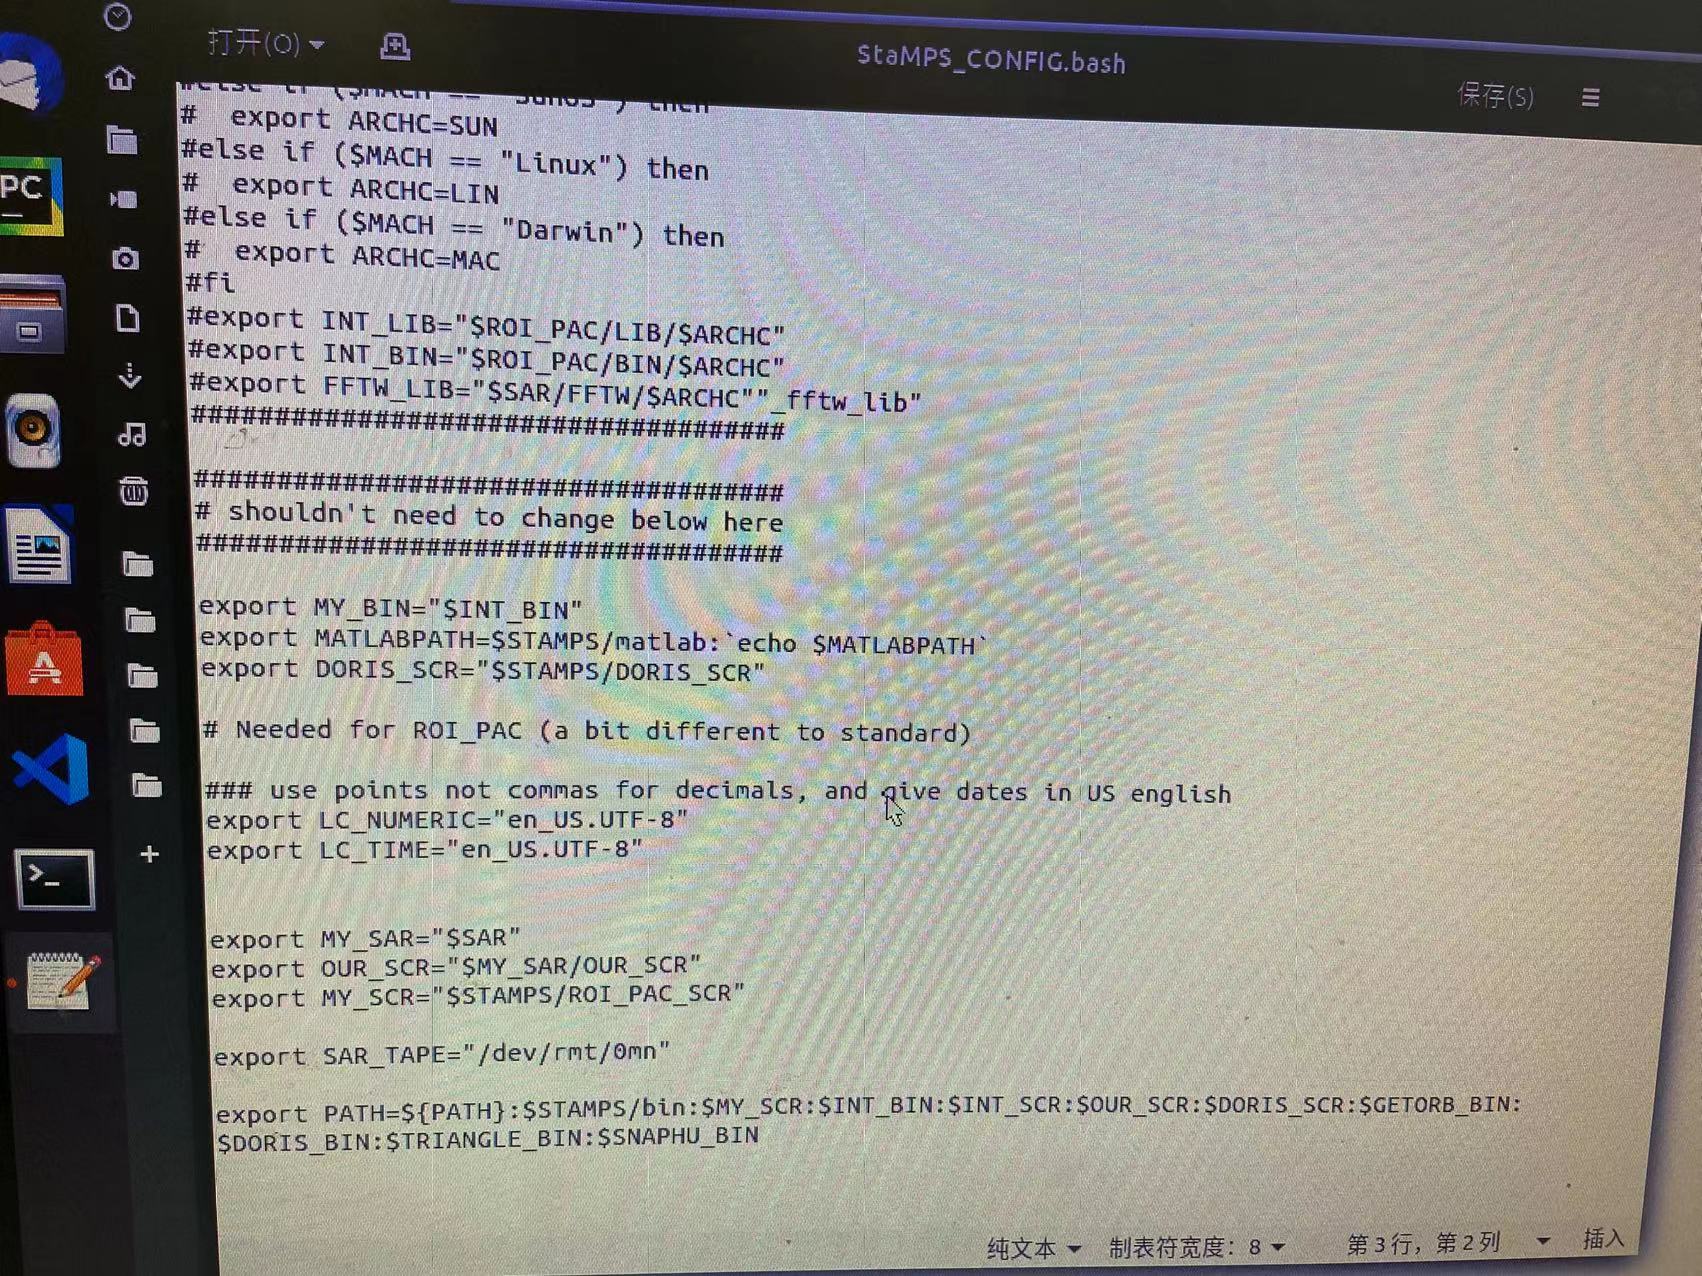
I really appreciate that you can anwser my question,but Ifound that I have made export path under my bashrc file,just like the picture shows:
oh good. please follow these steps,
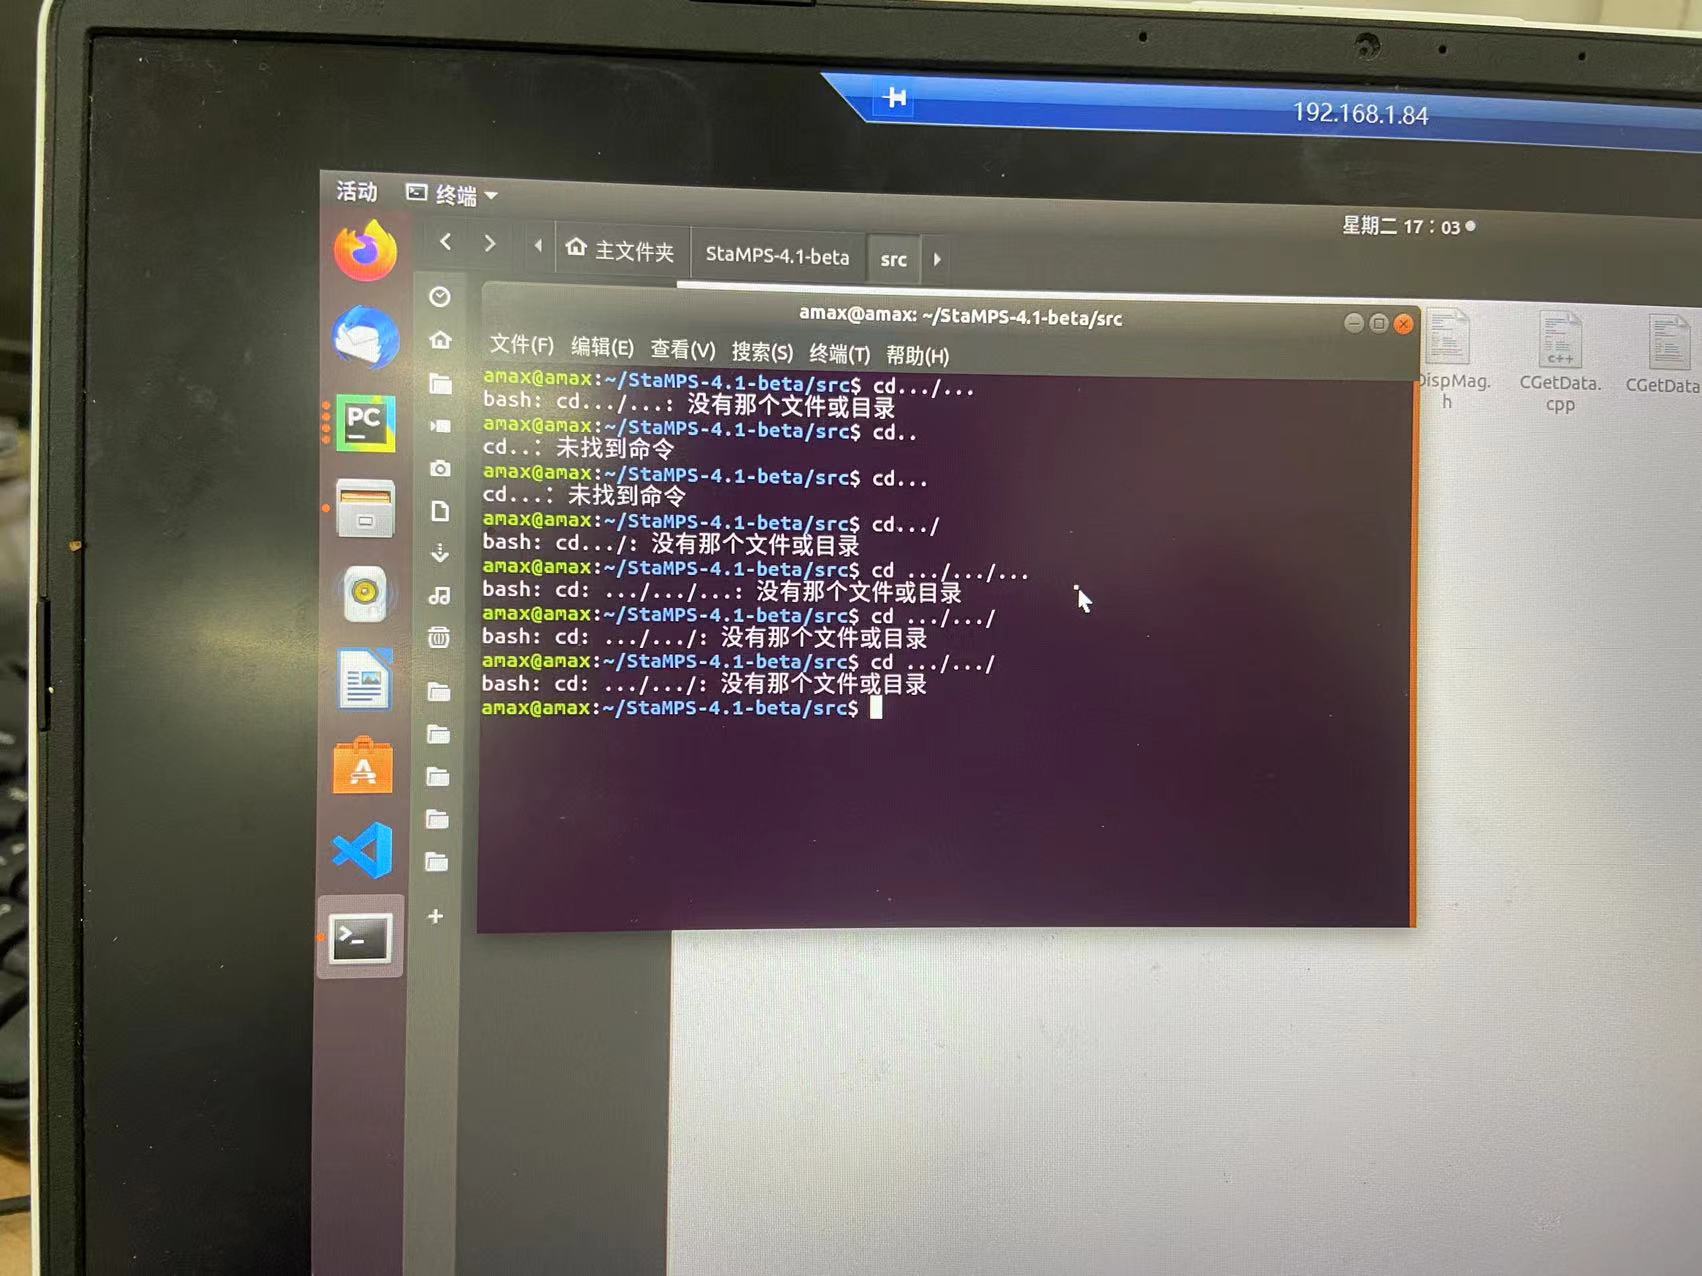
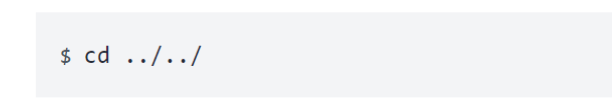
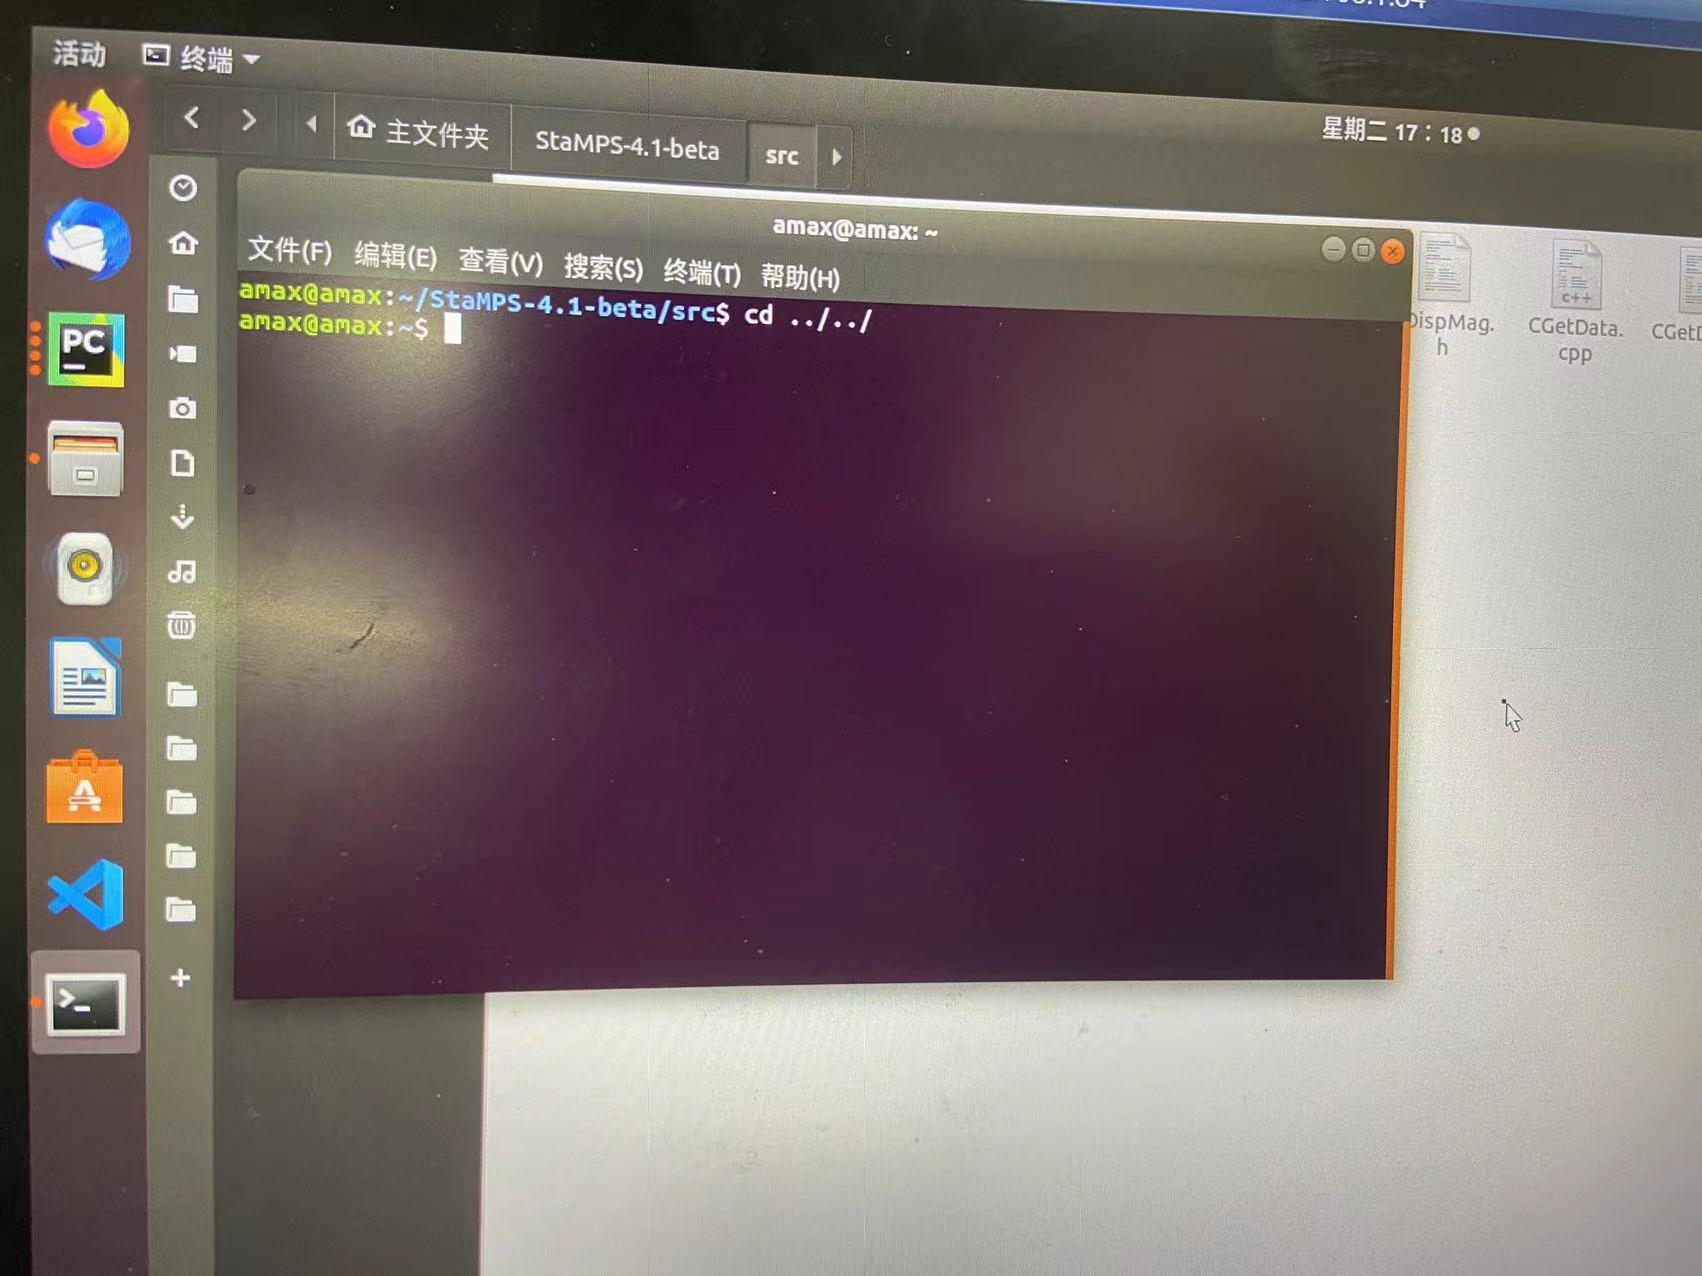
go two steps back from StaMPS/src folder using (cd…/…)
you will find the .bashrc file (hidden file), ls .bashrc gedit .bashrc
Then enter these below lines in to .bashrc file
export PATH= path up to bin folder (/home/username/Stamps/bin):$PATH
save .bashrc file source .bashrc