I have processed data of Jakarta area in Indonesia, for 2018-2019, which SNAP version 8.0.3.
13 rivers flow through Jakarta, and combined with the wet season rains and insufficient drainage due to clogging, it causes Jakarta prone to flooding. Moreover, Jakarta is sinking about 5 to 10 centimetres (2.0 to 3.9 inches) each year, and up to 20 centimetres (7.9 inches) in the northern coastal areas.
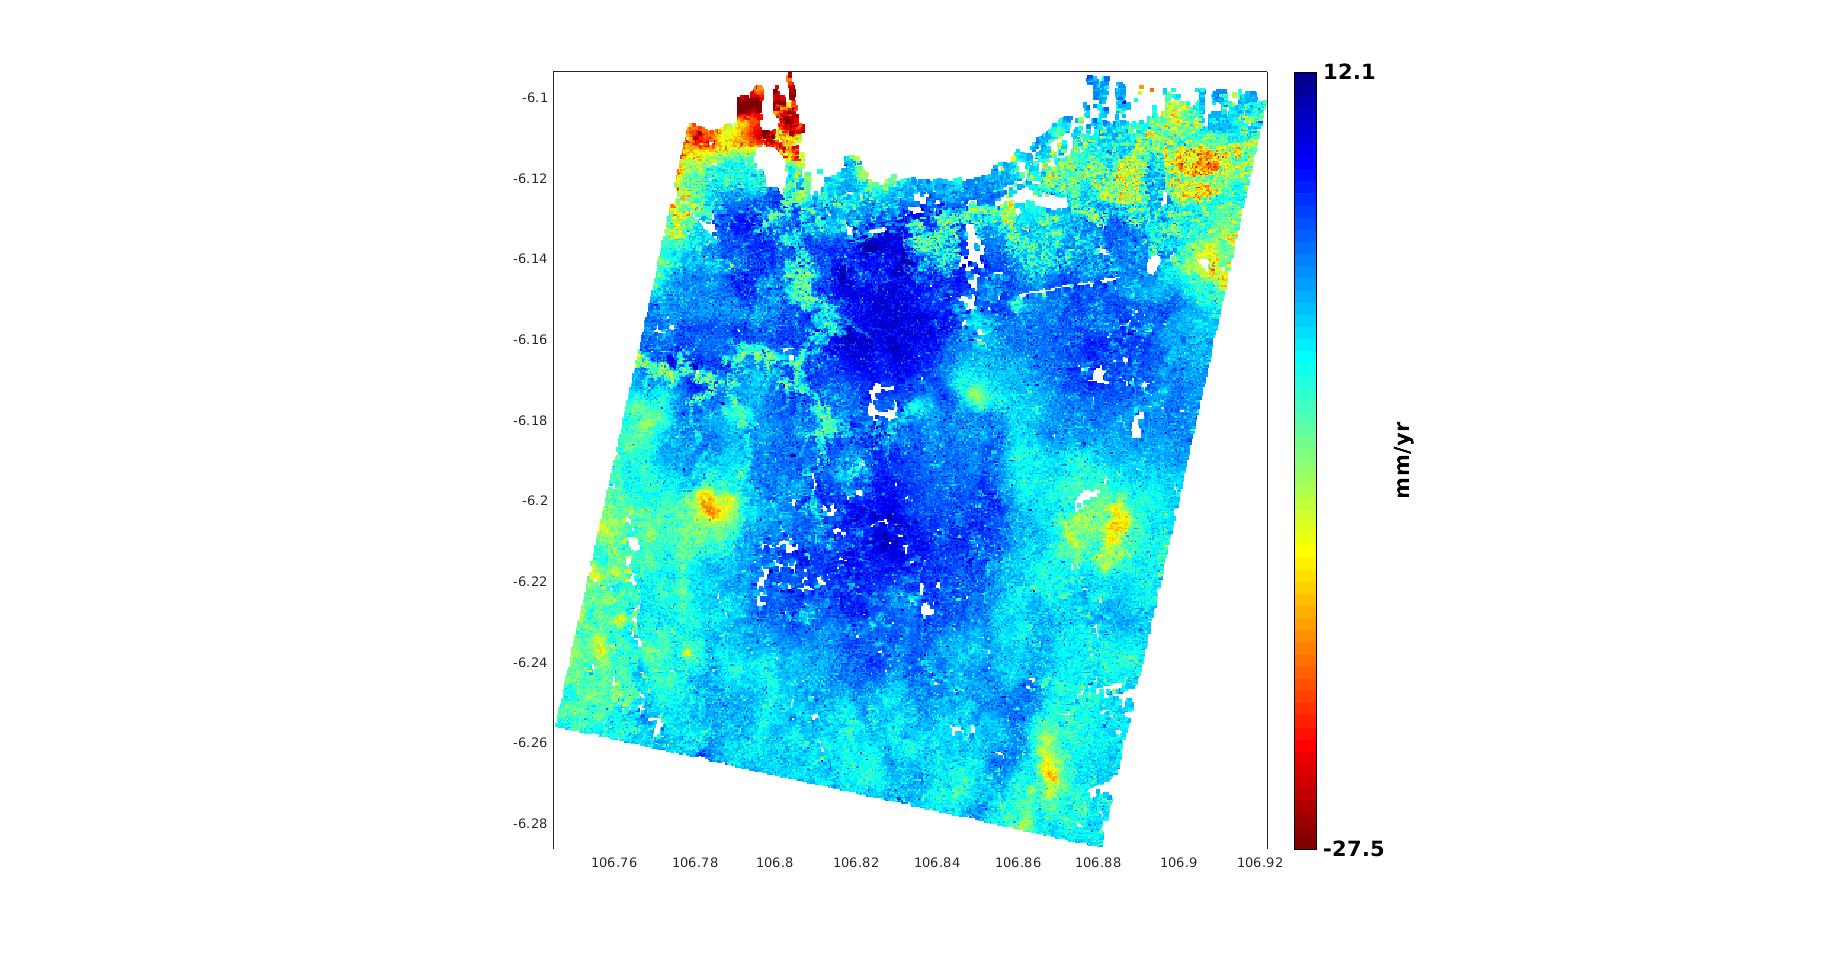
I used snap2stamps and produced deformation image using ps_plot(‘d-vo’).
The scale if deformation I get is -27 to +12 mm/year, which is not good according to the information above.
Moreover, the image matlab produces shows that the city rises (blue), not sinks (red) …
Also, how many images were used?
You can also plot a time series of the area of interest to see if it has a temporally stable behaviour or if the average displacement contains both uplift and subsidence.