By enlarging the study area to include more stable (e.g. urban) objects.
1 Like
I’m pleased to report I’ve managed to obtain an end product from the finished StaMPS process (with a partial data set of 40 images; I’ll be re-attempting it now with a 120+ image set).

That is the output from running ps_plot(‘v-d’,1,0,0) after the last StaMPS step finishes, which if I’ve interpreted the manual correctly, displays mean displacement velocity at each point?
I used the latest SNAP 8 with Ubuntu 18.04 LTS (computer specs in OP) and a 32 GB ram. All processing (from start to end) was carried out on a WD easystore 8 tb external hard drive, following almost exclusively the workflow referenced here How to prepare Sentinel-1 images stack for PSI/SBAS in SNAP - #514 by thho (except I configured SNAP for python2.7 using the installer, not manually).
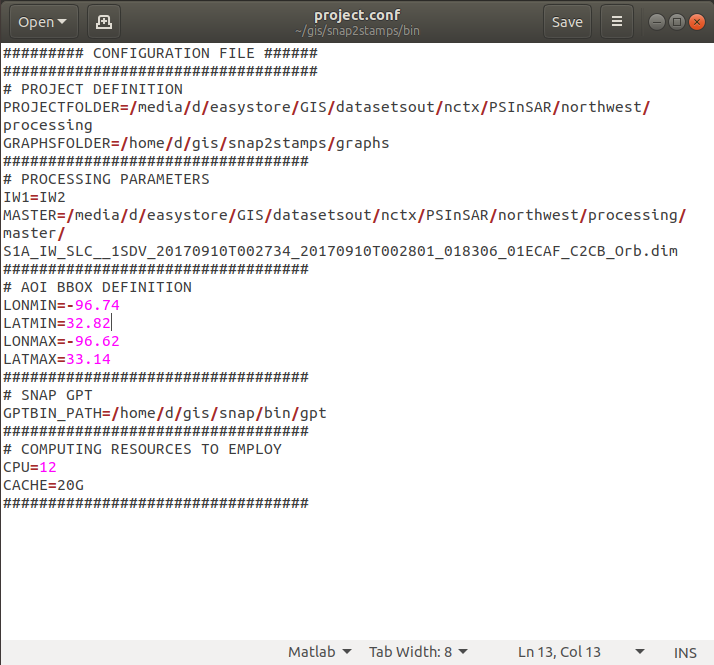
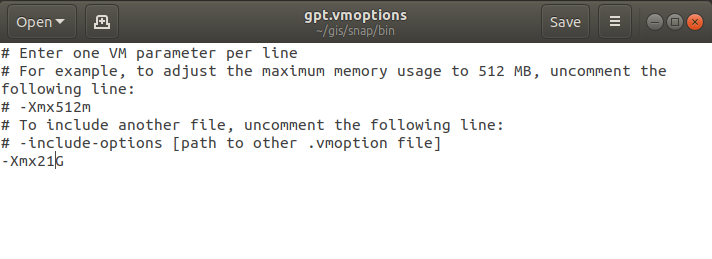
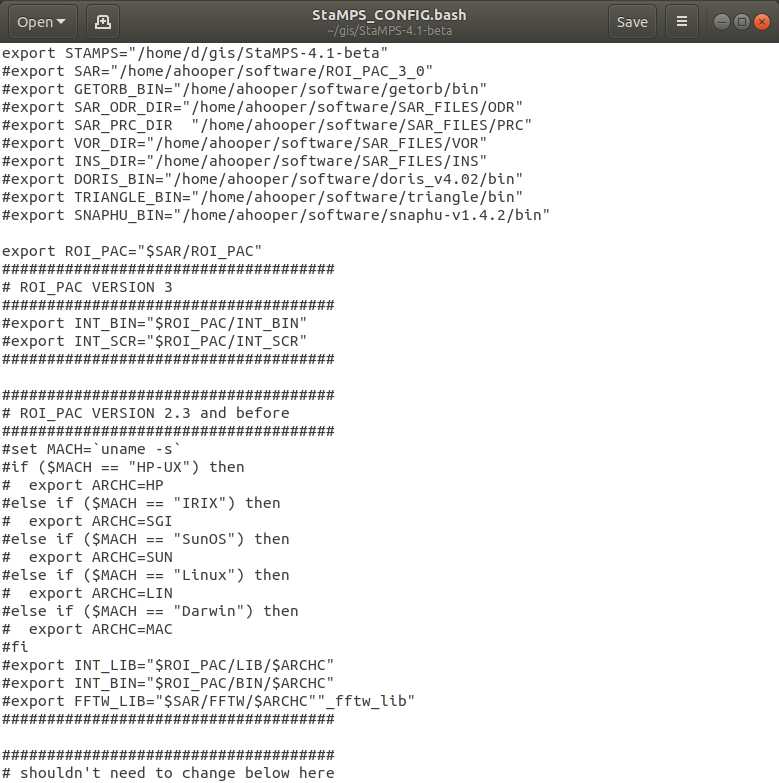
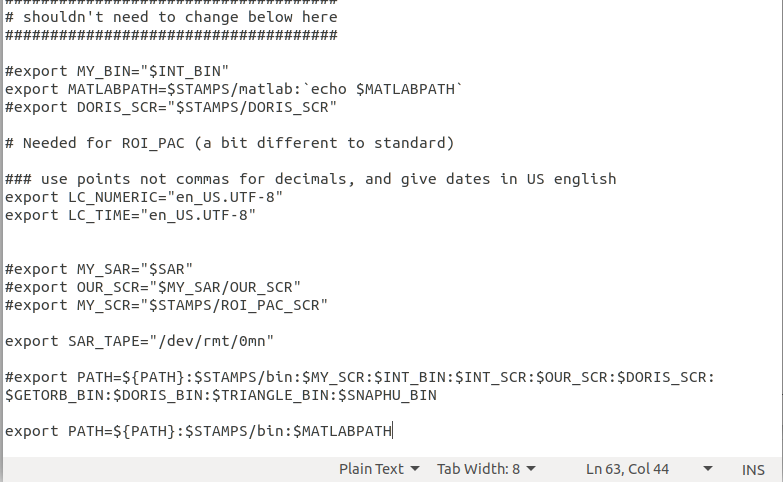
These are the project.conf, stamps_config.bash, and gpt.vmoptions files
All images were Sentinel-1a ascending; I used IW2 and three 3 bursts (still had to edit the coreg_ifg xml files, as described here How to prepare Sentinel-1 images stack for PSI/SBAS in SNAP - #514 by thho )
Thank you @mdelgado, @marpet , for providing these products which will be of great use! And thank you especially @ABraun for all the help!
Are there any further details I should look into at this point, to further validate quality?
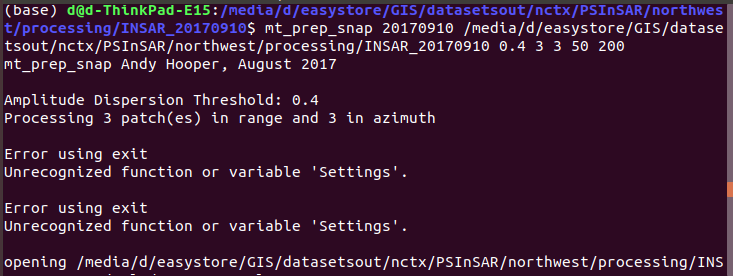
I just realized this message appeared when I ran mt_prep_snap. Any major issue?
3 Likes
Good job, congratulations!
Now you can try to tweak the variables most suitable for your case. There are some great explanations given here: StaMPS/2-4_StaMPS-steps.md · master · Matthias Schlögl / gis-blog · GitLab
At the end, variable configurations are recommended for different use cases.
It is always good to plot the time series of a local area to check if the temporal displacement makes sense.
1 Like
Ok, thanks.
I’ve managed to successfully repeat the process for a different location, but I’ve still not been able to run plot_v.gmt - I copied it into the INSAR processing folder, but upon attempting to run it at the end of stamps I receive the error
Unable to resolve the name plot_v.gmt
I ran ps_output and ps plot(‘v-d’,-1) beforehand to see if those help, but not change.
Couldn’t find any posts here or on MAINSAR regarding the issue. Any suggestions?
All of my interferograms contain data values and this error has occured after changing the da threshold in mt_prep_snap from 0.4 to 0.42 and while keeping the same number of patches as before. In patch 1 for example, when the da was 0.4, step (3) worked like a charm, but the same patch with da 0.42, this error message appeared. I only had to change the da value because some patches didn’t have sufficient PS pixels after step 3 to get weeded
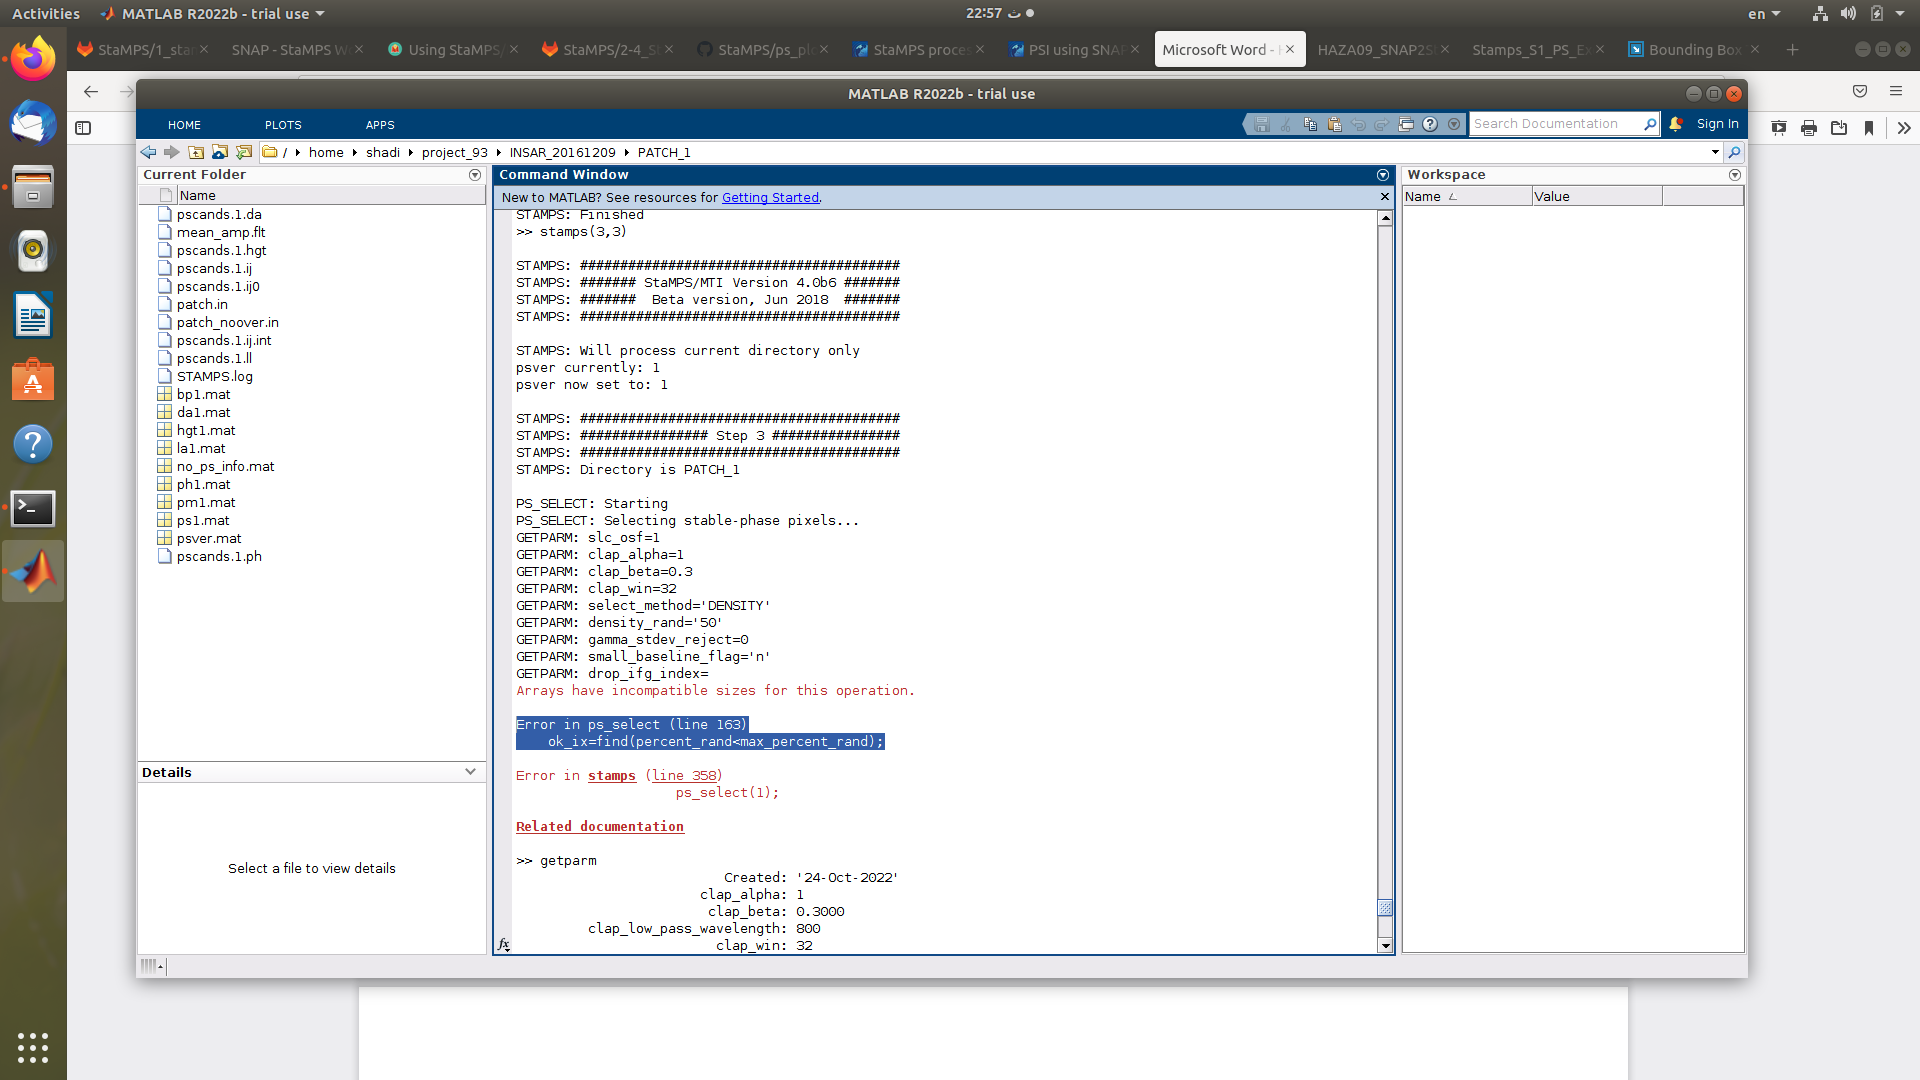
This is really weird but I figured out what’s causing this error.
Type:
setparm(‘density_rand’, 50)
instead of
setparm(‘density_rand’, ‘50’)
Drop the quotes from the number
1 Like