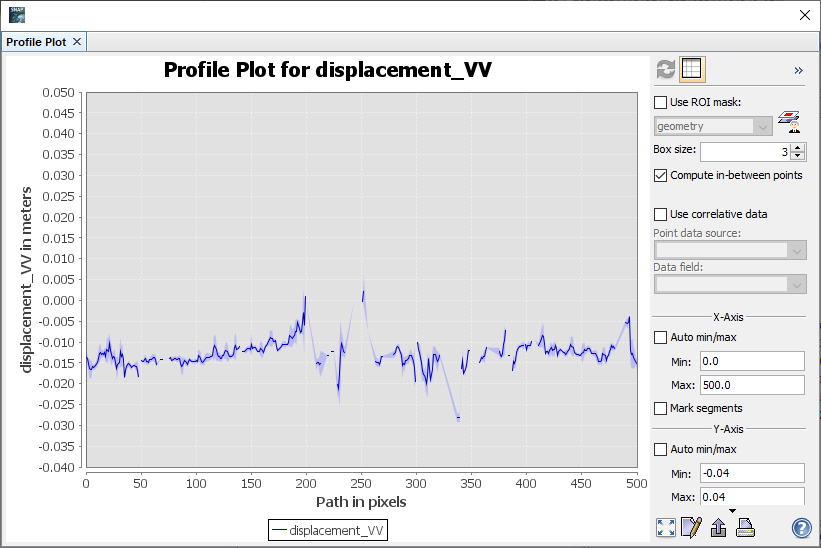
Hi. Thank you very much for your suggestions here, I really appreciate it. This is not an earthquake area or one with a lot of construction. Back geocoding looked fine. On the above example I used 3x3 tiles with a 20 pixel overlap. I tried exporting the same subset with no overlap and result changes so that the general displacement now tracks below 0 (around -0.015) (see graph below). (Don’t worry about the change in the number of pixels - I used a profile from multiple lines going across the area on the first one)
Most of the interferograms I’ve generated show a background displacement of around -0.015 over 6 or 12 days. I even swapped the slave and master over and it still tracked around -0.015. These images stacked over 6 months it shows an displacement over somewhere around 60cm/year which from my knowledge of the area surprises me (is should be no more than a few mm in either direction).
So there is a gross error, maybe operator, maybe something to do with the area or coherence, but I can’t spot what it is.
This site is on a coastal peninsula. If I use a larger subset, there will be a lot of water in the frame. Would this matter do you think?
DInSAR is always relative and the results can have offsets, introduced by various error sources.
Especially when larger parts of the image are of low coherence, the analysis of small isolated areas (of high coherence) can be problematic.
To minimize errors, you can try to Filter out low coherence pixels before phase unwrapping
I see no problem with the magnitude of displacement of a single pair here, because it remains the same after unwrapping (one cycle in the interferogram is still one cycle after unwrapping)
Thank you very much for the clear and very quick reply, and the links to the instructions both of which appear to address this issue. It is reassuring to know that offsets can occur and there is not necessarily a problem with this. It is also good to know that there is no obvious issue interferograms and the offset can be corrected if required.
Thanks again @ABraun for your advice on this. I really appreciate it.
60 cm LOS displacement is huge. Never came up against offsets in my S-1 InSAR data processing. Good to know. I hope masking low value of coherence helps.
I may have made a mistake here. As the displacement product is given as metres, I took it as metres over the period between the images for that pair (usually 12 days). When I stacked the 12 images together I divided the stack by 12 and multiplied by 365, when I probably only needed to divide by 12 to get the average annual rate of displacement (as implied by the first set of instructions that you highlighted). If this is correct, then the extremes relative to the background tie in much better with what has been observed on the ground.
Filtering out low coherence before unwrapping, and the correction to the displacement, seem to work much better and give repeatable results. Thank you. Just one final question. Is it best to apply the correction to bring the general background to near zero on each image pair or the average displacement product after stacking (or does it not matter since this is a differential technique)?
Thanks for the reply. I’m glad if uncovered something useful. As stated in the reply above the estimation was probably a mistake. Masking appears to be giving repeatable unwrapping results for this image pair at least (when adjusting the export parameters). It is good to know that the offset doesn’t mean that a part of the process had necessarily failed.
@ABraun I have a question too.
Suppose we’re not studying displacement rather CCD “coherence change detection”. Do you think in time-series analysis of vegetation there’s a need of masking out low coherence values. As you said “errors arises because of many reasons” how are we going to be sure that this value of coherence is not ambiguous?
No, CCD makes use of low coherence. But as in every radar analysis, three ability to detect small targets depends on the spatial resolution and the degree of noise. The more images in the time series the higher is the chance to identity random outliers.
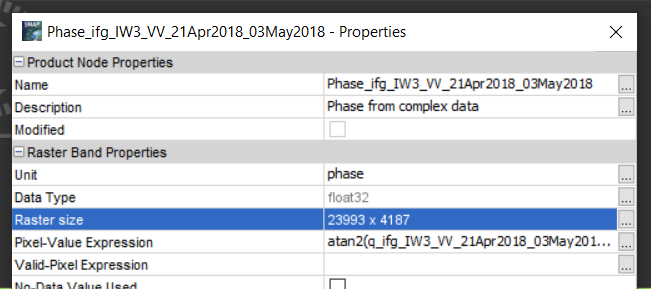
Pardon me, I couldn’t fully understand this figure. This is the raster size of the interferogram,
I have set the values of rows and column overlap to 200 yet I received and error message says the overlap is too little. I may double the size of overlap as you have mentioned before and see if it makes a difference.
yes, if the error message states the overlap is too small, you should increase it. But 24000 rows is quite heavy, to you really need them all? Maybe multi-looking the interferogram before unwrapping can speed it up a bit as well.
The Interferogram raster consists of only three bursts, I didn’t think it was heavy but it may take too long to process each burst individually.
According to your statement, aside from taking too long to unwrap so many rows, would that cause unwanted unwrapping errors? Hopefully not, because the interograms themselves don’t display a pronounced fringe pattern but I was told to continue to unwrapping step to see if there has been a surface motion detected at all.
Multi looking can cancel out minor phase noise, but if the interferogram quality is bad in general, neither filtering nor multi looking will be able to improve it. So simply continuing with the processing amr hoping for better results to emerge makes little sense to me.
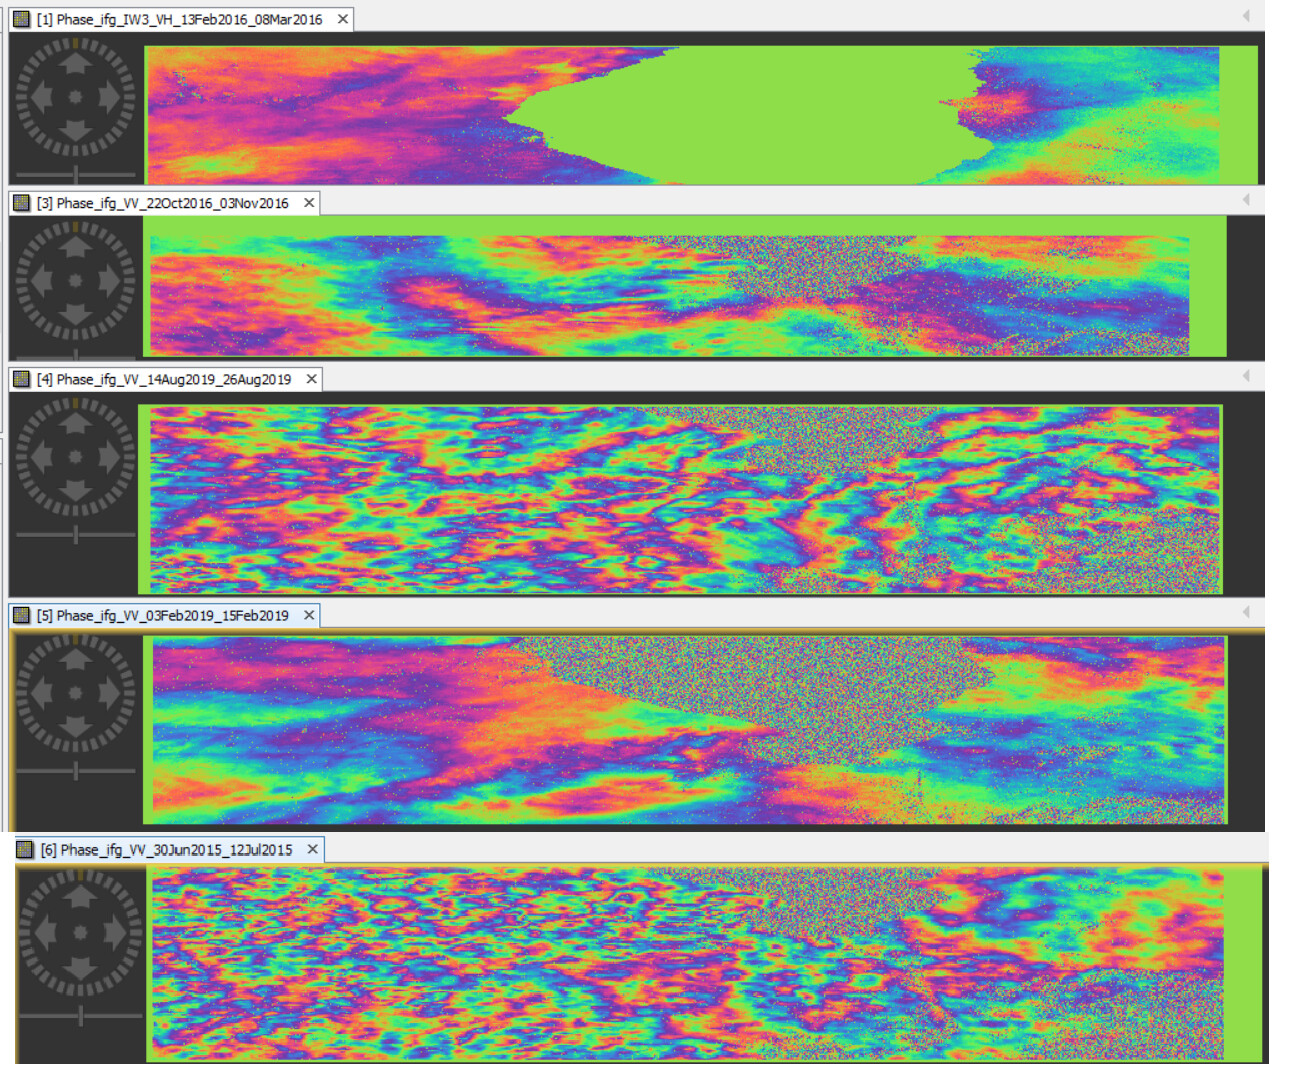
These are a few examples of how most if not all the interferograms in this area look like. I have included one more or one less burst for each interferogram based on the earthquake’s epicenter location just to test and check how the results would visually differ.
Some interferograms show no pattern at all, some will show pattern similar to the topography others display a very irregular pattern.
I know that may not make sense but I am trying to figure out whether the processing is faulty, or the past earthquakes shockwaves themselves had caused little to no surface deformation, so the radar interferometric processing won’t be useful to apply to this study area
do all of these pairs include an earthquake event?
The patterns are surely different. At least there is litte decorrelation of the phase. Still, we don’t know hoch much atmospheric contribution is in each of these interferograms.
I apologize for taking too long to respond, there was no notification. Yes, all those pairs include an earthquake event. here are three examples
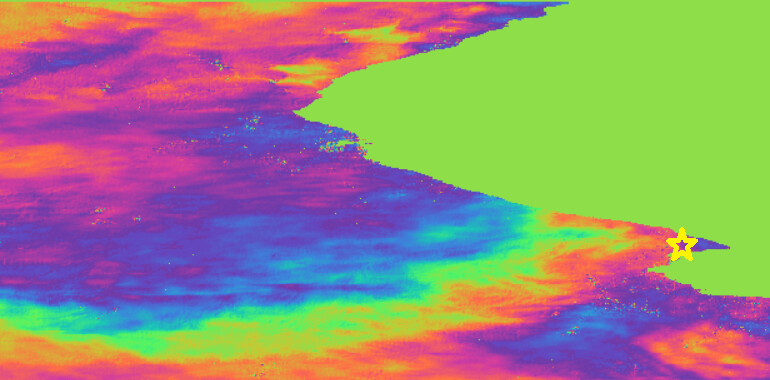
the first [13Feb-8Mar 2016} interferogram is for an earthquake incidence in 21-Feb-2016 with center depth 4 Km and magnitude of 3.2, the epicenter is located at the yellow star
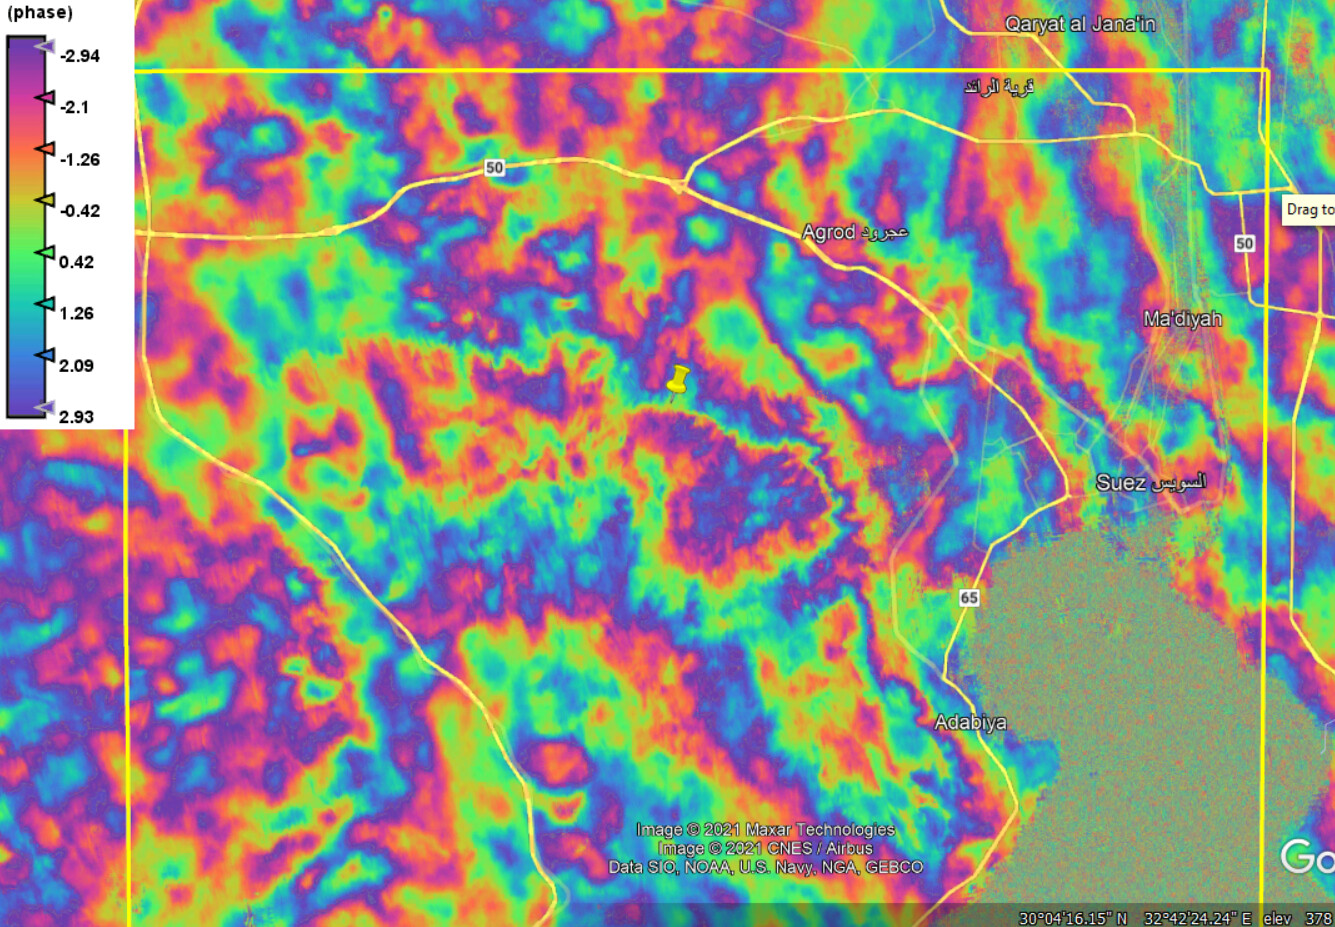
This [14Aug-26Aug 2019] interferogram is for 16-Aug-2019 Earthquake incidence with center depth 20 km and magnitude of 1.9, the epicenter is located at the yellow pin
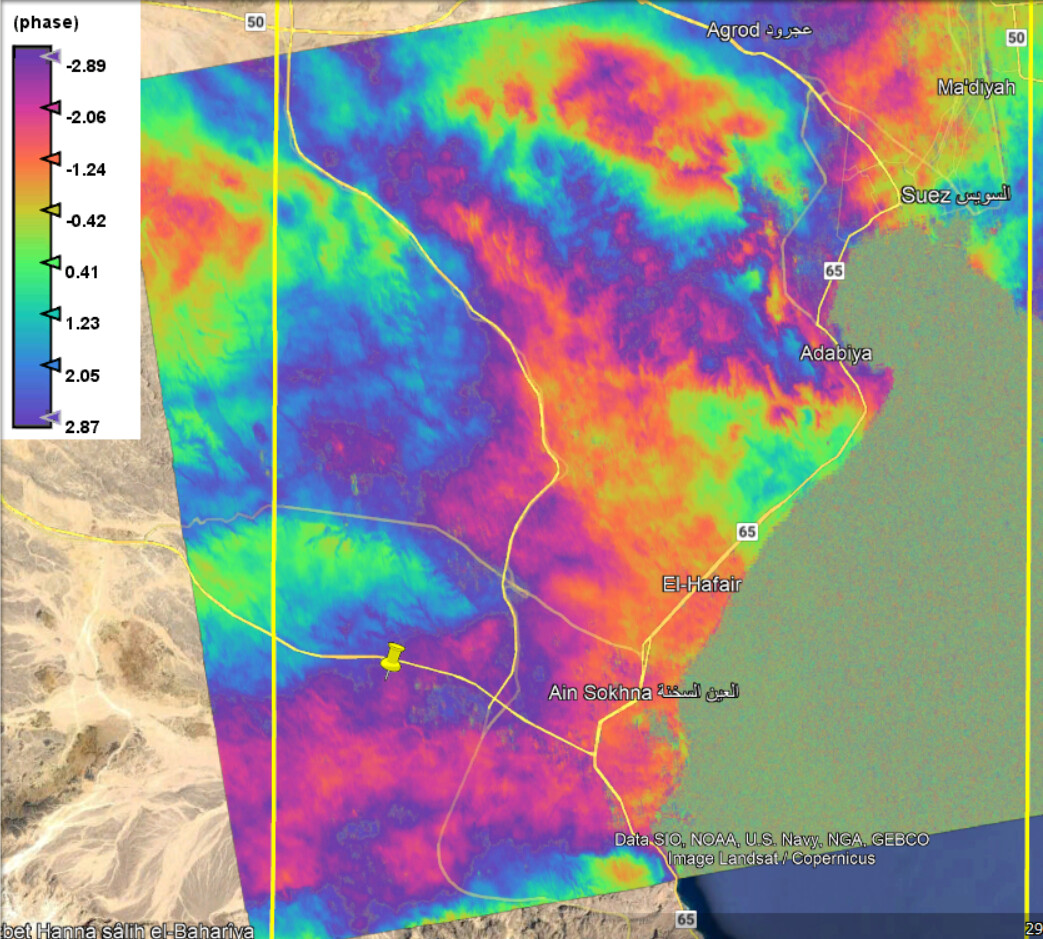
Another [3Feb-15Feb 2019] interferogram is for 7-Feb-2019 earthquake incidence with centre depth 0.1 km and magnitude of 2, the epicenter is located at the yellow pin
Hi @ABraun
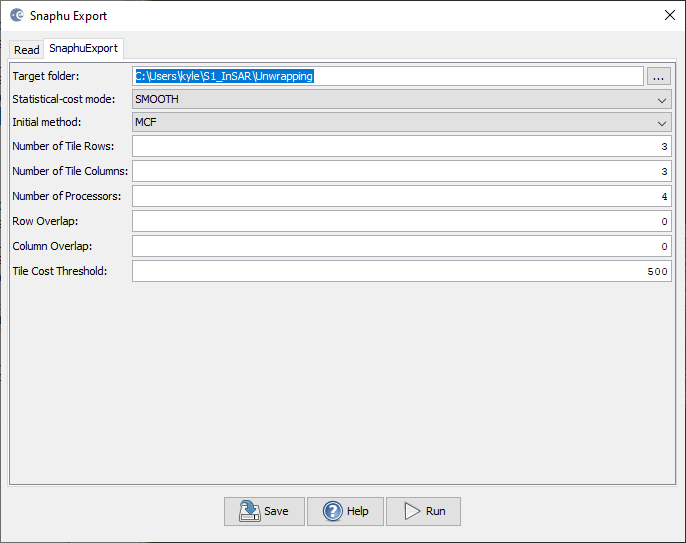
I am using the SNAPhu plugin within SNAP. I am totally new and have some problems running that.
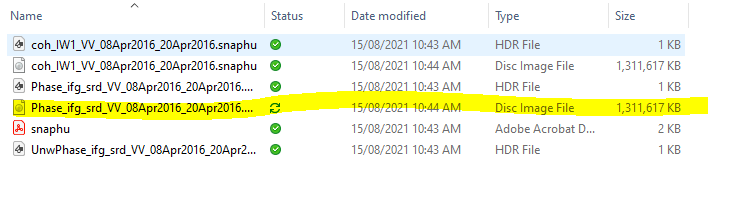
After SNAPhu exporting, I will have the file as below image.
And then use the highlighted file in order to do the unwrapping. The problem is that the process runs forever! after 4 hours I got only 7% progress. Could you please help me to figure it out? Thank you in advance