@johngan Thanks for your detailed replies. I’m implementing the change detection technique, as you described in your post from Oct 18 however on Sentinel 1 multi temporal imagery, not ASAR WS imagery as the paper describes.
A few questions I have are,
is the VH polarization of S1 more appropriate than VV for change detection?
is it necessary to compute angular correction for S1? since each pixel has a characteristic local angle that is unchanged throughout the year over my study area.
lastly, is it possible to produce a high resolution (10 m) soil moisture index map using Sentinel 1 imagery? the paper you cited only mentions spatial resolution once, i.e. 75 m ASAR pixels are averaged to a 1 km grid to allow low sensitivity pixels to be processed. In my case multi-temporal imagery (3 yrs) gives me a high sensitivity > 3 dB over the arable and barren land of my study area, hence is it necessary to average the resolution of S1 images or can I retain the 10m resolution?
The problem with VV polarization is that the vertically polarized microwaves are affected by vegetation (HH pol is less sensitive to vegetation) and the penetration through soil is minimized. VV polarization can detect the differenceswithin the vertical vegetation structure from various growth stages. As M.R.Saradjian and M.Hosseini, 2011 mentioned, after experiments, HV cross-polarization proved to be more accurate than HH or VV polarization for areas with some vegetation.
The backscatter coefficient as a function of incidence angle declines. The larger the incidence angle the lower the sensitivity of the microwave. Hence, we can identify larger errors in our measurements at large incidence angles due to the low sensitivity. It is recommended to perform an incidence angle normalization at approximately 30 degrees.
You can perform soil moisture analysis using Sentinel-1 data. there is no need to down-sample your 20m resolution to a coarser one
Thanks @johngan for that reply
to your second point, incidence angle normalization is necessary to correctly analyse spatial distribution of soil moisture in areas where topography varies? Is it still important if I am only concerned with per pixel changes in soil moisture over time.
Further I looked into the forums regarding incidence angle normalization, specifically these posts, [1] and [2] and this paper my interpretation is that the normalization process gives us gamma-naught which is sigma-naught/cos(local incidence angle). is this correct?
The papers you are looking at refer to terrain flattening which is different from incidence angle normalization.
Terrain flattening is applied to an area with local tomography. Due to the terrain variations, your back-scatter intensity is affected accordingly leading to misleading results. Hence, by applying terrain flattening we can remove some of the ambiguities introduced due to topography.
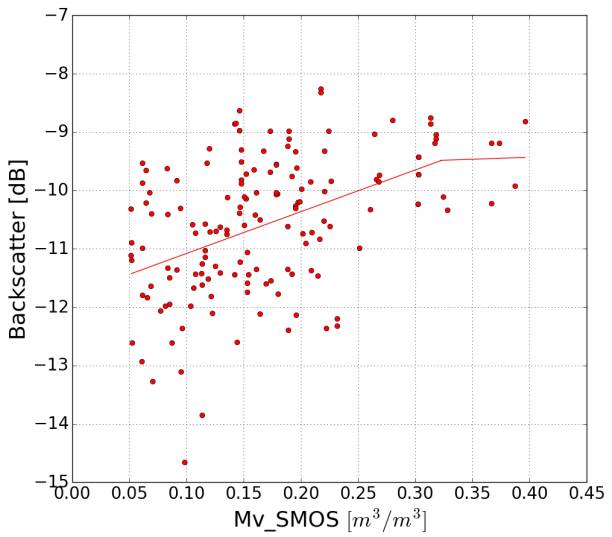
In terms of incidence angle normalization, it is required when we do measurements over flat areas. The backscatter intensity drops as the incidence angle increase (figure below)
If you look at the graph, you see that the larger the incidence angle the lower the amplitude. Looking at the images, we see how eh brightness varies from left to right. So, the brightness variation does not have to do with the properties of the materials (as someone would expect), but instead, with the incidence angle range. For accurate results, we need to correct for this.
Have a look at this paper here
So, if your area of interest is flat, then you need to do this step.
In case your area of interest has a lot of tomography, then you can apply terrain flattening
Not all materials scatter in an isotropic manner, therefore the incidence-angle can affect backscatter. In other words, part of the intensity variation can be signal.
thanks johngan, that reference helps.
so the squared cosine correction should work over land.
and if I have to perform both terrain flattening and local incidence angle correction does the sequence matter?
first terrain flattening and then incidence angle normalization or vice versa?
Yes I agree, part of the intensity variation in the SAR image is signal.
The point i am trying to make is that Incidence angle variation can affect our results when working, for instance, on SAR image classification over flat areas (e.g sea ice types, land cover, e.t.c).
When materials of the same type are distributed across the SAR image , the backscatter intensity of this material located in near range will vary with the one located in the far range of the SAR image. Hence, due to the differences in intensity, this will end up having high misclassification errors.
Hello!You said:“ In my case multi-temporal imagery (3 yrs) gives me a high sensitivity > 3 dB over the arable and barren land of my study area”.How Can I check the sensitivity by SNAP. Thank you!
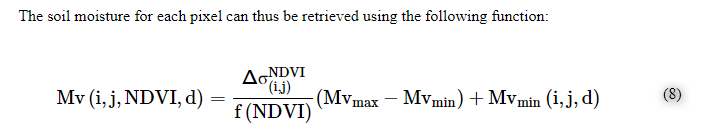
Dear johngan, I’m currently working on my diploma thesis in which I compare different change detection approaches for soil moisture retrieval. Two of the compared methods are those proposed in the article you reference in this thread ( Synergetic Use of Sentinel-1 and Sentinel-2 Data for Soil Moisture Mapping at 100 m Resolution). I understand the logic of both the methods and I was able to reproduce all of the steps. However, in the case of the first of these methods I got confused in the last step - applying the following formula:
The Mvmin(i,j,d) refers to the driest value (Mvmin) acquired by the Sentinel-1 over a date d.
In the equation, in order to derive Mvmax and Mvmin, it requires a time series of S1 images from which you can derive the min and max values. Hence, Mvmin(i,j,d) refers to Mvmin of a specific day instead of deriving Mvmin from a time series image acquisitions.
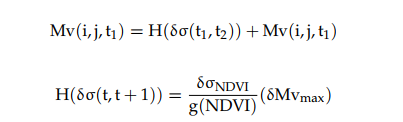
However, I’m not sure that I understand you correctly. Does it mean, that Mvmin(i,j,d) refers to the lowest soil moisture value recorded over the whole study area on date d? And if so, in order to obtain actual soil moisture (Mvmin) value from backscatter values of Sentinel-1 (100 m) pixels, do I use the relationship previously acquired from S-1 and SMOS image time series (displayed below)?
In terms of Mvmin(i,j,d) calculation, you are right.
To derive Mvmin, the Authors used a time series (2 years) of S1 data and compared it against SMOS soil moisture data acquired at the same dates as S1 data.
There is a strong correlation between radar backscatter and SMOS data
Sorry, my question wasn’t clear enough. You said: "The Mvmin(i,j,d) refers to the driest value (Mvmin) acquired by the Sentinel-1 over a date d". What I meant was, in order to retrieve Mvmin(i,j,d) in volumetric units (m3/m3) out of Sentinel-1 backscatter values, should I use the same relationship used to obtain Mvmin and Mvmax? So some kind of linear function, which will allow me to pair certian S-1 backscatter value to volumetric soil moisture?
You will need to perform a regression analysis between SMOS and SAR backscatter (as shown in the figure you posted) to derive volumetric units. SAR backscatter gives you intensity values according to the surface roughness and moisture, so, in order to derive the results in m3/m3 units you would need a linear function
Hello MHrnciar I am doing my MSc thesis on soil moisture mapping using sentinel 1 and I want to adopt the change detection method specifically method 2 because according to the paper you mentioned I can produce soil moisture map using two consecutive images but I don’t understand the equation can you please help me?
Please can you explain what this equation means I have Sentinel 1 backscattering coefficient and I want to produce soil moisture map Using method two which is in the article you reference in the ( Synergetic Use of Sentinel-1 and Sentinel-2 Data for Soil Moisture Mapping at 100 m Resolution)?