The first equation (Mv(i,j,t1)) refers to the soil moisture. The first component of the equation (H (δσ(t1, t2))) refers to the backscatter difference of the two scenes acquired at different times. The second component (Mv(i,j,t1)) is the volumetric soil moisture of your AOI. You should either collect soil moisture data on the field or download a soil moisture product derived from eosdis.nasa.gov
In order to find (H(δσ(t1, t2))) in the first equation, you need to implement the second equation. The enumerator refers to the difference of NDVI between the two acquisitions (dates similar to the Sentinel-1 acquisitions), for the denominator g(NDVI) states that the backscatter coefficient is a function of NDVI which means, the higher the radar backscatter the higher the NDVI index. Hence, you need to perform a regression analysis between NDVI and backscatter values. Finally, (δMv max) is the maximum value of the soil moisture data (after taking the difference of soil moisture between two dates)
Thank you so much for your prompt response and brief explanation but still, I have some questions
when you say (Mv(i,j,t1)) is the volumetric soil moisture of your AOI.Do you mean one soil moisture value for the whole study area or pixel-wise?
when you say for the denominator g(NDVI) states that the backscatter coefficient is a function of NDVI which means, the higher the radar backscatter the higher the NDVI index. Hence, you need to perform a regression analysis between NDVI and backscatter values.why should I perform regression and what to use from it?
Finally, I want to know that is it possible to produce soil moisture map for my study area by applying these equations with in-band maths in SNAP? Many thanks for the help.
Please can you explain to me about the paper Synergetic Use of Sentinel-1 and Sentinel-2 Data for Soil Moisture Mapping at 100 m Resolution? I mean in the paper it says that the study area of this research covers 20 km by 20 km area and it also says that they used SMOS low-resolution moisture products which have 40 km by 40 km pixel resolution to drive Mvmax and Mvmin. if I am not mistaken this implies that their study area falls in half part of one pixel.so does it mean they used one-pixel soil moisture data for the entire study area to drive max and Mvmin? many thanks for all responds?
They have used both in-situ and SMOS soil moisture data. They have used SMOS data because they did not have enough field measurements.
So, they collected SMOS data for two years and recorded the soil moisture value of the single pixel that falls into their AOI. They did a regression analysis between all those values recorded from SMOS (single pixel) and data from sentinel-1
if you want pairs of Sigma0 and NDVI you first combine both in one product using Collocation (SAR as master). Then you digitize an area on your raster, right-click on the raster and select “Export Mask Pixels”
I was suggseting this because you might get different relationships between NDVI and Sigma0 for different surface types which are not visible in the overall plot.
If you want to export all pixel data at once, you can select File > Export > CSV
this gives you a structure like this SAR_NDVI.csv (1.0 MB) which allows you to perform a regression analysis.
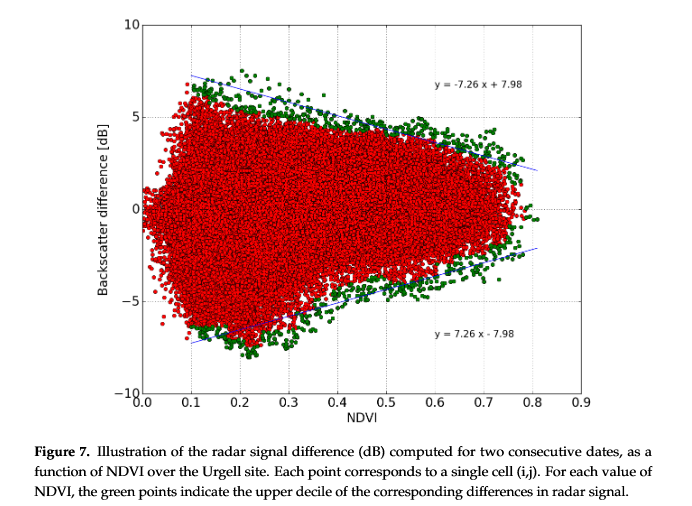
Okay it worked and can you please tell me the way to find the upper decile figure 7 which is found in the article in the ( Synergetic Use of Sentinel-1 and Sentinel-2 Data for Soil Moisture Mapping at 100 m Resolution)?
You need a stack with both SAR images and the NDVI layer. This allows you to calculate the difference between both SAR images and plot it against the NDVI at each pixel.
The upper decile and the bounding linear equations will probably have to be calculated in MS Excel or another statistics software.
as the NDVI is a conitinuous measure, they probably made subsets of all backscatter values at defined NDVI intervals (e.g. 0.11, 0.12. 0.13…) and identified the quantiles for these subsets.
to know the quantiles, you have to export the data to a table and use tools like excel or SPSS. I have never done this, but this was my guess. Maybe you write to the authors and ask them how they did it.