how did you get the upper decile please?
Hello can anybody help me how to calculate my field measurement in band math combining with raster data? my field data are not showing up in band maths
The Band Maths works on a pixel-base and can only process data which is stored as a mask or raster band inside the respective product.
What kind of field data do you have and how did you import it? It’s not very clear to me what kind of calculation you want to perform.
My data is soil moisture data and am working on change detection method two which is on the paper ( Synergetic Use of Sentinel-1 and Sentinel-2 Data for Soil Moisture Mapping at 100 m Resolution).and in this paper It asks the SMC data in a pixel-wise and I want to implement this method
this one? https://www.ncbi.nlm.nih.gov/pmc/articles/PMC5621168/
Maybe you can name the exact position where you refer to.
If you have point-like measurements, you can only plot them against SAR backscatter in the correlative plot. Points cannot be directly used in the band maths (I don’t think this is necessary either).
Is it an option to use the pin manager to extract SAR backscatter at the measurement points and perform this calculation outside SNAP, for example in MS Excel?
ya you are right this is the paper.
and thank you about the solution
Hello forum I made a regression between Mean sentinel 1 radar signal as a function of SMOS soil moisture and i got an equation with a value of coefficient of determination is equal to 0.6 . So i want to know that can i take this relation to proceed to the next steps. I mean is it good relation form your perspective.Many thanks for all respondents.
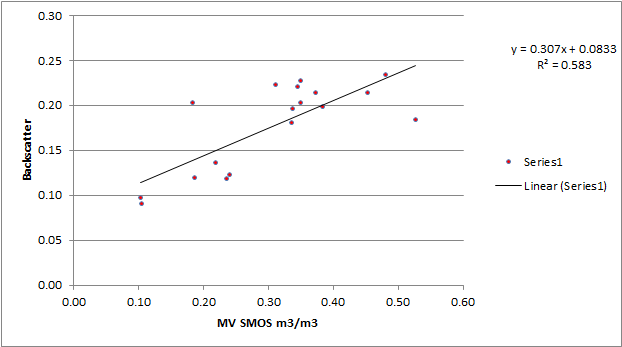
an R² of 0.58 means that you can explain 58% of the variations of soil moisture (measured by SMOS) by Sentinel-1 data.
I see a linear trend here, but it is not based on many values. So you have to be careful when you apply this equation, it might not be valid everywhere, but only at locations which are similar as the measured points (no vegetation, no artificial objects…)
Looking at the scatter plot, it could also be a exponential (or polynomial) relationship which flattens towards 0.25, depending on if you consider the 0.18/0.20 value as an outlier or not.
Hi, Aburan the figure below shows my study area in a SMOS image as you can see it my shapefile doesn’t cover the whole pixel can I calculate the weighted mean of an area in Snap for these pixels?
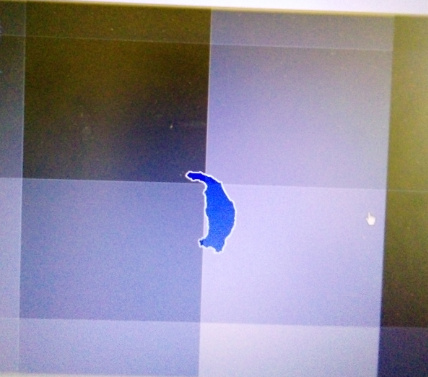
I don’t think so, but you can use the zonal statistics plugin in QGIS for that.
Besides the technical aspect - do you think it makes a difference to include the fractions of the other three pixels? Especially as you are only touching their boundaries…
I thought it is better to see if there is a difference
 please can you explain how to get this which is found in the papear Synergetic Use of Sentinel-1 and Sentinel-2 Data for
Soil Moisture Mapping at 100 m Resolution
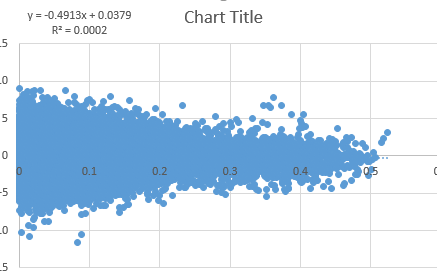
Hello, forum in the figure below I get a result which is not similar in the paper Synergetic Use of Sentinel-1 and Sentinel-2 Data for Soil Moisture Mapping at 100 m Resolution.what do you think i mean do you see an error in the graph?
I don’t think there is an error. Depending on the study area and landcover type the relationship between backscatter and NDVI could be inverse (larger difference with higher NDVI).
But I’m not very familiar with the paper to be honest.
Hi,
You should not expect your results to be identical with the one in the paper. Your Area of Interest is different with the one mentioned in the paper. The graph in the paper shows that as the NDVI increases, so does the backscatter intensity. This does not mean that vegetation is the only factor that influences the radar response. It is a combination of vegetation, surface roughness and presence of soil moisture.
In your case, it looks like that there is a higher backscatter response as the NDVI get smaller. That potentially shows that the area of low vegetation might be situated is a rough terrain where the presence of soil moisture is quite hence. So, teh contribution of the terrain and the moisture yields high response.
On the other hand, the area of dense vegetation (high NDVI) might be located in a flatter area and the presence of soil moisutre is quite low. So, you do not get a very high response.
That was my assumptions judging from your plot. I do not really know your AOI, so my assumption might be wrong.
1 Like
Hello,
As you mentioned in the 3rd point for Soil moisture retrieval, the “two-tailed test” is essential for the determination of Dry and Wet reference. So can you please explain it in detail how to perform this in SNAP or any article regarding the same.
Thank you, looking forward to your reply.
Regards
Hi,
To derive a reference backscatter intensity value for wet and dry periods you just need to do the following:
- collect a time-series of data acquired over both dry and wet weather conditions.
- Take an average of the driest and wettest values. To do this, we can take the 5% of the values that are the lowest (very dry) from the dry reference and the 5% of the values that are the highest from the wet reference (very wet). You can create a distribution of the data for both wet and dry conditions and take the values on the lower end
SNAP is a great tool for earth observation analysis and it provides the band math for simple mathematical calculations. You cannot use band math for relatively complex maths. In your case, I do not think you an do all these statistics in SNAP. i would recommend you using programming language to achieve this.
Thank you. Let me work with this first.
Hi johngan
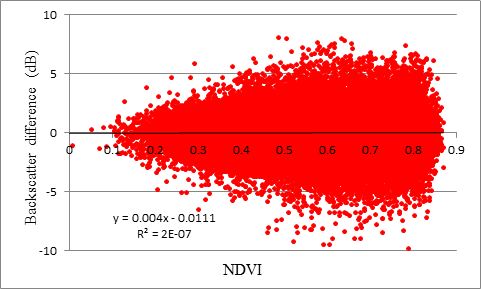
If you remmember last time i have posted aplot which was between backscatter change and NDVI for two consecutive dates of sentinel 1 for my study area and the result was totally different from the previous study and you were telling me that I shouldn’t expect to be identical and now I have plotted it between backscattering change and NDVI difference.Can you please say some thing regarding this?