I’m trying to apply the first method proposed in “Synergetic Use of Sentinel-1 and Sentinel-2 Data for
Soil Moisture Mapping at 100 m Resolution”. I read your replies to this topic and I’ve seen that many of you are using this method, so I’m here to ask for your help.
I’m stuck with equation (3) and the following ones because I can’t understand how I can have multiple radar signal differences for a given (i,j) cell and for a given NDVI value since Sentinel-1 data have been resampled to 100 m, while Sentinel-2 data have been not.
I already have processed with SNAP a set of Sentinel-1 data to obtain 100 m backscattered signal rasters (in dB); also I have already processed with SNAP and GDAL a set of Sentinel-2 data to obtain 10 m NDVI rasters at the same dates of Sentinel-1 data. How can I go on with this method?
Really thanks to those that will give me help.
Hi,
It is hard to judge just based on a graph but it looks like that your graph follows the expected shape when plotting the values.
I assume that you are in the right direction
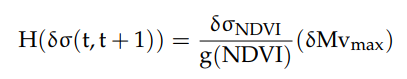
okay to make my quastion more clear when I calculate H ( ) I got value such as
38.68723117
-7.481770359
-25.30095394
-7.982179124
40.29405279
i am so confused please do you have any idea
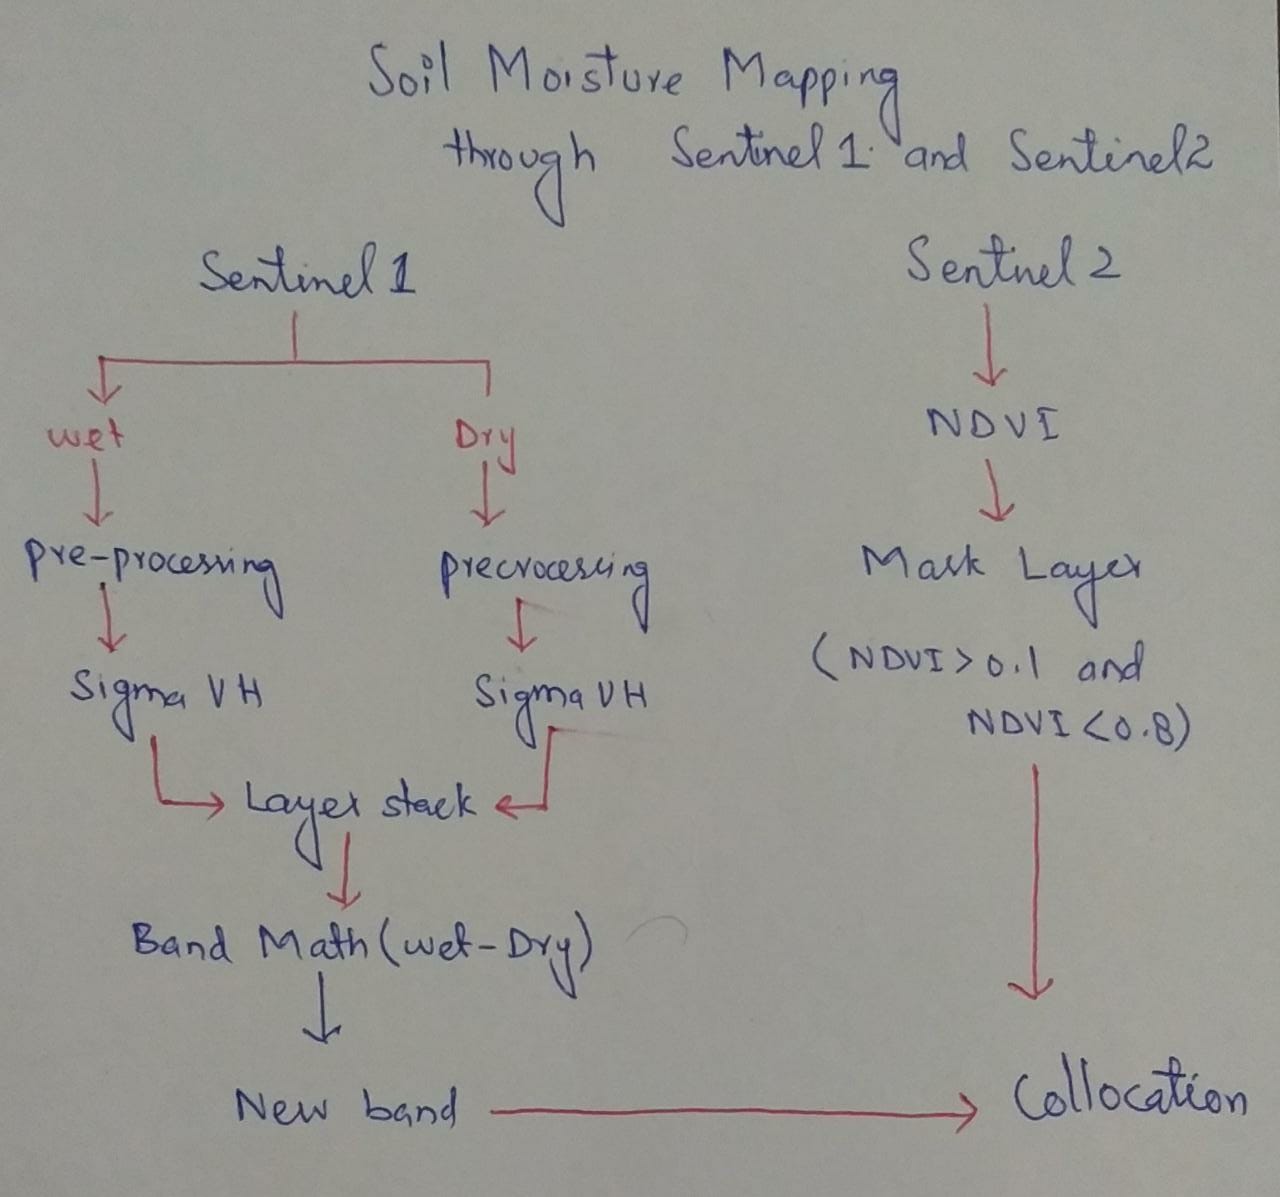
sir, I processed the S1 Both images ( in wet and dry conditions) in Sigma0_VH, Now I want to subtract these, How can I do this?
According to my point of view, I must have to stack both layers and then use band math to proceed further. Can you tell me how can I do this means through SNAP tools?
If both images are projected and terrain corrected, you can use Radar > Coregistration > Stack tools > Create Stack
If the products are not projected yet (there are several reasons to do it later) you can use Radar > Coregistration > Coregistration
ok Thanks sir I got this,
The paper “Synergetic use of Sentinel 1 and sentinel 2 data for Soil moisture mapping at 100 m resolution”…
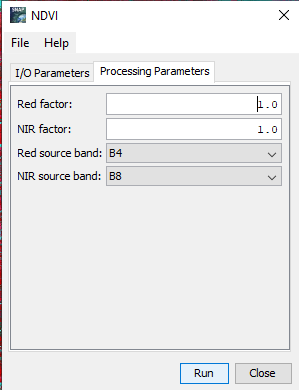
In present studies the NDVI over the studied agricultural land ranges between a minimum of 0.1 and a maximum of 0.8. How can I apply this threshold to NDVI product. Is this Range is Red factor or NIR factor? see the attached Image.
no, this is not related to the factors in the tool. First you calculate the NDVI, then you create a mask in the Mask Manager: NDVI > 0.1 AND NDVI < 0.8
Then you stack the NDVI mask with the Sentinel-1 data and use this mask as a valid pixel expression.
Sir I want to use method two to map soil moisture in the paper(Synergic us e of sentinel 1 and sentinel 2 soil moisture mapping at 100m resolution),…
kindly help me out, what is the next step to map soil moisture,
I don’t know this study, sorry. If you have identified the steps which are required to replicate it, we can try to help you performing them in SNAP, but you have to do the reading and the conceptualization.
So let us know at which point you struggle.
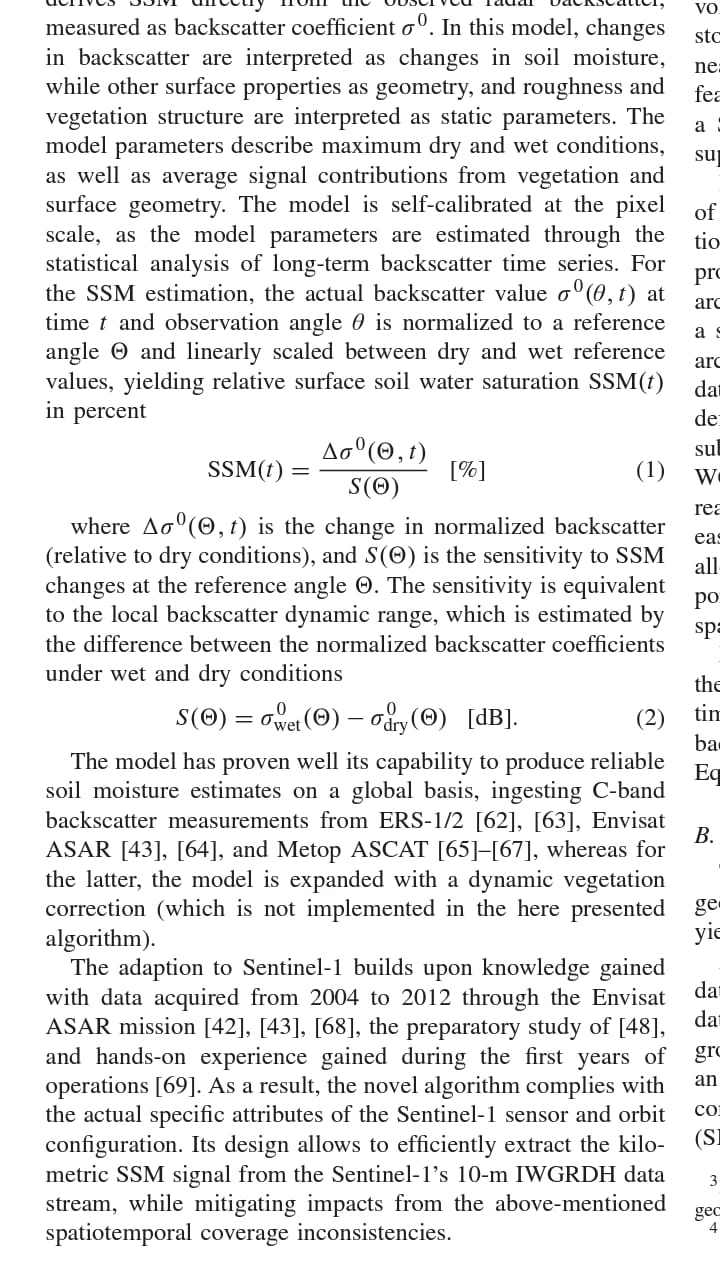
The above equation refers to SAR indidence angle normalization. As the incidence angle gets wider, the intensity of the backscatter drops (mainly in flat areas). So, the incidecne angle is normalized based on a single value (e.g 35 deg) which means that, it is as if the SAR image was captured under an incidence angle of 30 deg.
You need to extract the values along the sar image (from near to far range) and plot them against the intenisty values and produce a graph to derive teh coefficients
 ) I got value such as