Sir, Can you please elaborate on this question? I didn’t get this point.
I want to get all the parameters of the equation through SNAP using Sentinel 1 data
Hi,
You should do the following:
- Draw a line a long the sar image (from near range to far range) and extract the pixels values(backscatter) along the line.
- Do the same for the incidence angle band
- Plot the backscatter values against the incidence angle values. Perform regression analysis (fit a line in the data) which will give you the coeffecient
The term β in the equation is the coefficient derived from the regression analysis. The term θ is the incidence angle band
1 Like
Hi,
1- you mean I have to draw a line using a drawing tool in SNAP. which is starting from near range (left side of image) to far range (at the right side of the image).?
Please guide me on how to extract pixels value along with the backscatter along the line?
these things are explained in this tutorial: Synergetic use of S1 (SAR) and S2 (optical) data and use of analysis tools
1 Like
We have extracted pixel values and save it in EXCEL file , now how i can make regression line and find value of coefficient
please have a look at these instructions: Add a linear regression trendline to an Excel scatter plot
1 Like
by placing incident angle value on x-axis , i got this result . how can i found coefficient value from this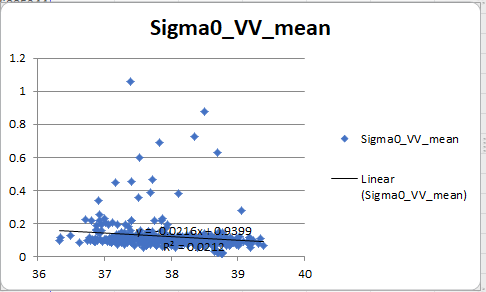
1 Like
maybe you can exclude all pixels with backscatter > 0.3
This will hopefully give a larger R²
You can do this in Excel by filtering the table: https://www.businessnewsdaily.com/10057-excel-table-formatting-and-filtering.html
1 Like
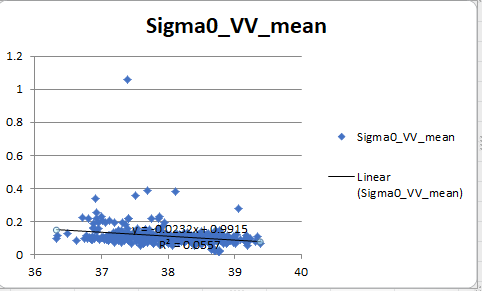
I still see little correlation. Did the study you refer to maybe work with db scaled data?
@johngan shouldn’t do calibration to Sigma0 reduce the impacts caused by incidence angle variations?
1 Like
here is quite more correlation , so how can i calculate coefficient from this and calibration is already applied on sigma0 value
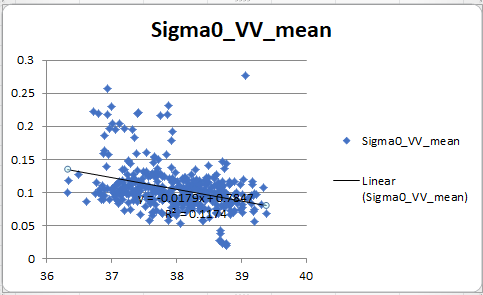
in the study, the backscatter values are extracted in logarithmic scale
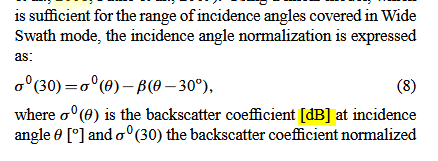
If you really want to replicate the approach, please convert Sigma0 to Sigma0db before extracting the values along the line.
Mabye this also gives you a better correlation coefficient. Because if you would apply the one from your regression, I expect that you will ruin the data instead of improving its accuracy. The overall aim is to reduce the variation with respect to the incidence angle, but by calibrating to Sigma0, this has already been achived.
So personally, I would skip this step (as long as you are using images from the same track) because I see the risk of introducing patterns which changing your data too much based on this regression. Unfortunately, the authors of the paper do not present an example of their regression. Also, the incidence angle in your study area ranges between 36 and 40 while it ranges between 15 and 40 in the study (ENVISAT WideSwath), which implies the stronger need of incidence angle normalization compared to your data. In my opinion, more important than the angular normalization is the next step where you extract the dry and wet reference data.
@johngan what do you think?
As you said I make this graph of sigma0db Vs Local incident angle. I found the value of “beta” is 0.4537…is it correct or not?
secondly, as you mention above my study area’s incident angle lies between 36 to 40 degrees. what should I choose to proceed next?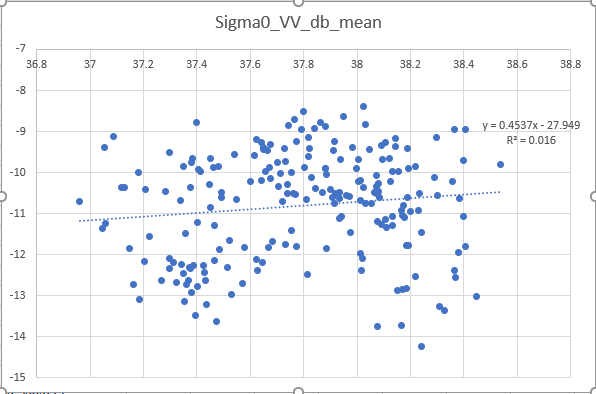
there is no right or wrong. Basically, the equation tells you that if you multiply the backscatter by 0.4537 and subtract 27.9 you will get the normalized backscatter. But as I said in the previous post, the R² is so low, that you will probably not improve the quality of your data by doing this.
In my opinion, having Sigma0 values is sufficient to proceed with the equations on soil moisture.
It is important that you are the one who undestands what these steps are and if they make sense for your case. It makes little sense to strictly follow a recipe if the data and methods do not contribute to a correct result.
so, sir, there is any way to improve the value of R²?
As you said, “having Sigma0 values is sufficient to proceed with the equations on soil moisture.”
1- I am able to calculate the value of S( by subtracting the sigma0(wet) to sigma0 (Dry).
2- What value should I write on the numerator? If I don’t use the value of the backscatter coefficient normalized band.
3- Check the equation 9.
Waiting for your kind response
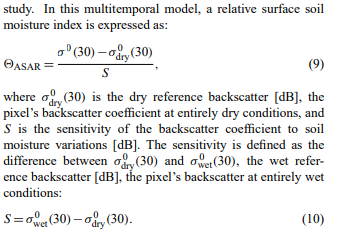
as I understand it, σ0(30) is simply the Sigma0 band. So it’s probably easier to first compute the band of S, then divide Sigma0 of a point in time minus the dry reference band by S.
Should I use NDVI-masked data or the full AOI for calculating the two-tailed test statistics - i.e. wet/dry refs? Thanks!
Hi lufa,
If your AOI contains different landcover classes such as urban, then you should maskout urban and use the whole AOI to calculate wet/dry. You cannot estimate soil moisture over urban areas.
1 Like
Thanks for the quick response - that makes sense.
I don’t have any urban landcover, but I do have low vegetation and a large body of water within the AOI. Currently I am masking out vegetation based on NDVI as suggested as well as the open water surface.
It sounds like you are recommending including vegetation pixel values into the wet/dry reference. Is that correct?
Hi Lufa,
ideally, for soil moisture analysis, we would like the vegetation cover to be as minimum as possible. Vegetation can affect the backscatter intensity. I would suggest remove areas of very dense vegetation.