Hello , thank you for sharing your theis it very interseting i have a question howa did you extract site of interest in snap ? what software are you use to do dress your map? I need that 
Hi annakisara
The image processing is all done in the SNAP software.
After image processing and befor you geocode to the geoprojection (eg. WGS 84) you create a subset (right click on the image, select the rectangle you want to focus on)
North arrow, scale bar and the grid can be applied in SNAP, via Layer Manager (right windows-side, click on the circled plus symbol, mapping tools and there you select your preference)
Kind regrads
Don
sorry for the late answer
Thanks for sharing…I look at it:slight_smile:
hello,
As ABraun mentioned, one phase cycle difference between acquisitions, this can be interpreted as a half of wavelength change on the line of sight.
Looking at the image (produced using SNAP) we see the color progression from green to red. Is this one cycle change ? which translates to 2.8cm. So we can say that in red areas we expect a subsidence or uplift of 2.8cm
is that right?
thanks
no. An interferogram gives you the difference of phase between both images.
But as this is given in +PI to +PI (one full cycle of the phase) you need to unwrap it to get absolute values.
1 Like
One phase-cycle is red-to-red = 2pi
1 Like
I want to thank @ABraun @mengdahl for your answers.
My research focuses on subsidence analysis for an urban environment south in Vietnam. I have downloaded 12 images, processed them, stacked them and finally obtained the subsidence map. Doing a subsidence analysis in that area is challenging because humidity and pressure is very high (almost all year round) as well as high temperature which affect the signal a lot. So, in order to improve my results, i tried to investigate each individual interferogram trying to detect any artifacts or high phase values( caused from atmospheric errors) and remove them from my processing. I am going to need to help to see whether my interpretation is correct or not. So, i would like to show you two of the interferograms created for the same area of interest as shown below.
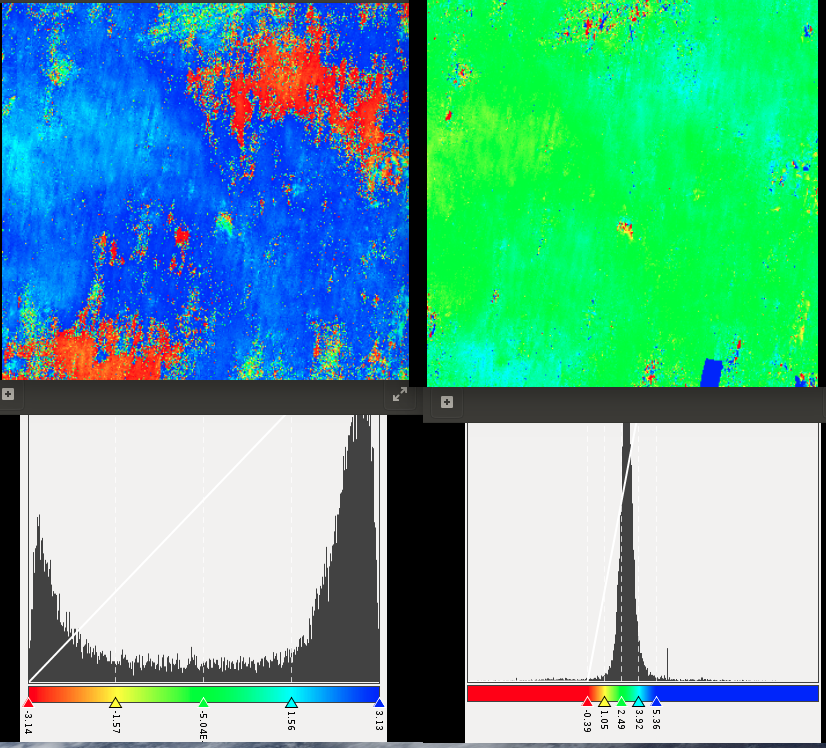
Fig1: interferogram formed for month August and September
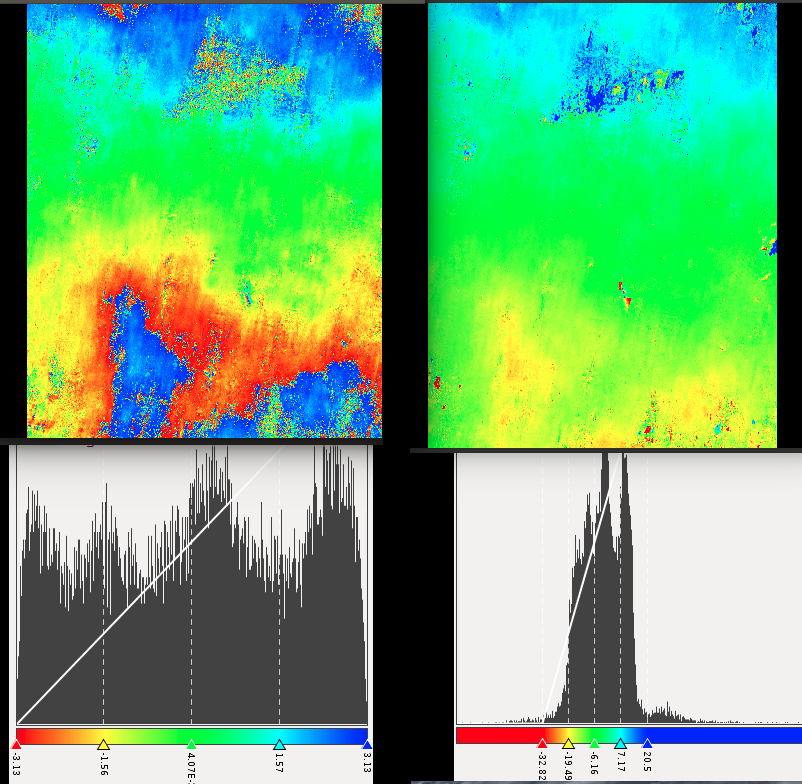
fig 2: Interferogram formed for the months Septermber October.
First of all, we know from previous studies that the displacement (per year) in this area is between 0 and -6. The intereferograms i am displaying here formed for a period of one month. Hence, we do not expect high displacement to occur, in other words, we expect the phase to be close to zero (I hope i am right on that).
Looking a the interferogram on the top (August,September), we see that the phase is constantly high across the image. I do not see a smooth color progression (from red to blue), instead it goes from red straight to blue. Is this happening due to atmospheric errors? is this a ‘phase jump’ or it looks normal?
On the other hand, for the next interferogram (for the same area of interest), we see a color progression from blue (bottom-up) to blue. Is this interpreted as a change of 2.8 cm? I see this color progression happening when elevation changes . In my case, tpo-phase was removed and the area is flat. So, i guess this is due to atmospheric errors.
I have few other interferomas that look like the ones i have shown you above, and some other that phase approaches to zero (which seems more normal to me).
To me, the interferogram in figure 2 does not look good. I cannot explain all these fringes formed, so i guess thats atmospheric noise. So, i decided not include in my process.
Is my interpretation close to reality or i am completely off?
thank you in advance
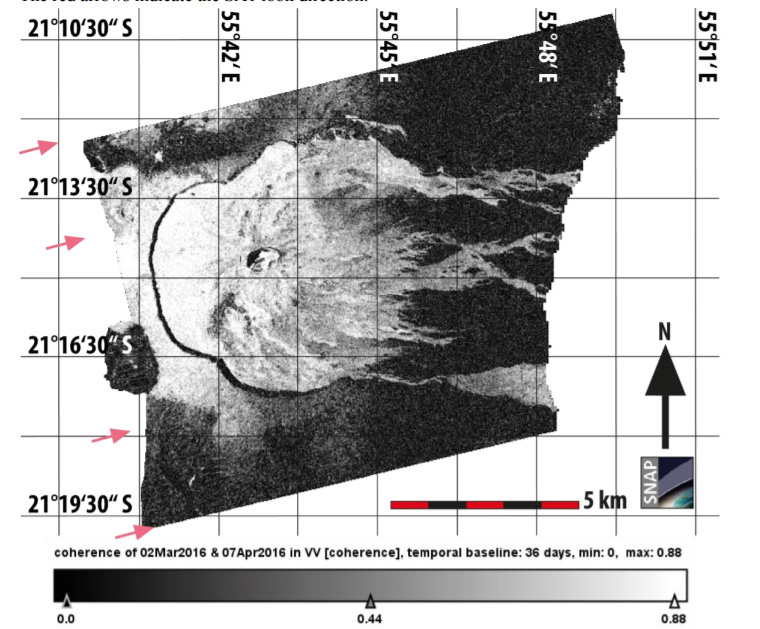
It is a good start to sort out those interferograms which make no sense or have too much noise.
But you should definitively have a look at coherence of your image pairs. It is a spatial indicator for the quality of your interferogram. Not every part of the image can be trusted, especially in areas with strong atmospheric effects, as you say.
You should not directly relate colour cycles to absolute displacements. Please have a look at this site - it shortly describes the difference between a wrapped and an unwrapped interferogram:
http://vldb.gsi.go.jp/sokuchi/sar/mechanism/mechanism04-e.html
2 Likes
Hi Phill, I’m Muhammad Budi, I have read your master thesis and I’m so interested with it. Can I get the processing steps in atmospheric correction? Because I am now doing my thesis too about DInSAR. I can learn all methods about atmospheric but I still don’t understand some.
Thank You
Hi, Ihave one ask
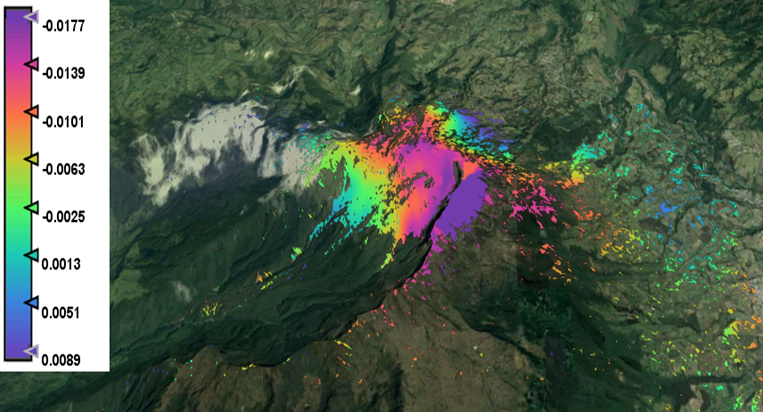
this is one of my result, but I want know if are the values positives are elevation of terrain and if are the values negatives are subcidence. or if there is other interpretation.
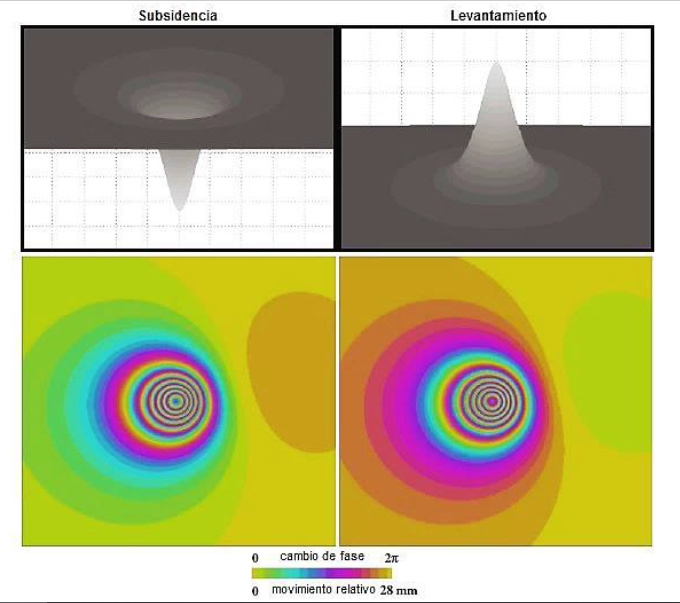
I found one document (Interferometria radar de apertura sintética aplicada al estudio del movimiento en laderas aledañas al volcan Calbuco con ayuda de imágenes Sentinel 1A. David Emmanuel Hermosilla Diaz, Santiago, 2016) where it say that the sequency of colors determines if it is a subcidence or a lifting.
my question is, what determines the type of movement of the land, the colors or values that throws the results palette or other evidence in the result image?

Hello @dongiatti
I am happy I came across your work which was referred by @falahfakhri for one of my queries.
At the moment I am looking at some interferograms generated with S1 pair (Atmospheric Fringes) and I would like to clarify if the fringes are atmospheric or result of actual displacement. I would like to try out your method to mitigate the atmospheric elements if any.
Regards
Arnab
Sorry, for directly addressing you @qglaude, but I have a rather basic question, and the referenes I found are a bit contradicting:
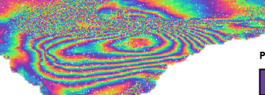
I have calculated an interferogram of two Sentinel-1 images with a known geometry (no topographic phase removal).
How do I calculate the amount of topography represented by one fringe, based on wavelength, incidence angle ect.? Any reference or suggestion is helpful.
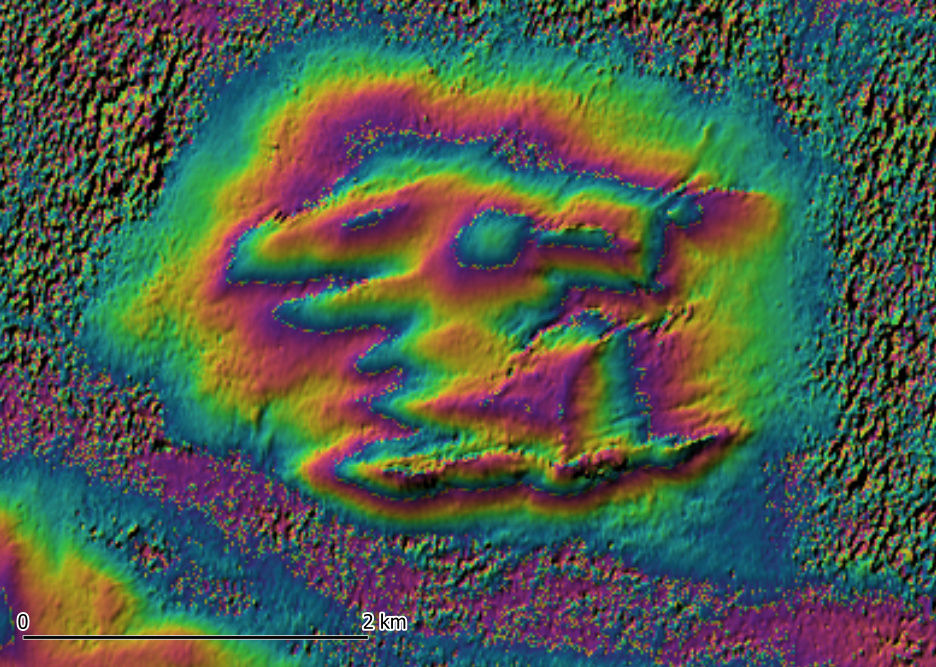
In theory, each cycle represents the wavelength of 5.5 cm, but the hill in this example (interferogram draped over the hillshade) is way higher than just a couple of centimeters, so I’m obviously missing a central point here.
Hi Andreas
No problem and don’t hesitate to do so.
There are things that require clarifications in your request.
So in first approximation you just have topographic and deformation phase components.
By surface variation, you mean the deformation, right ? It is a bit ambiguous. But in the same time you say you did not remove the topography. And deformation is not dependent of incidence angle.
\phi=\dfrac{4\pi}{\lambda}\cdot d_{\mathrm{LOS}}
Still for the deformation right? This is almost correct except that you need to divide by 2.
Set \phi=2\pi, i.e.1 cycle in the above equation, and you’ll find 2.78 centimeters. This 2.78 cm displacement will induce a 2\pi shift in your interferogram.
I have the feeling that what you are missing is that the optical path difference in interferometry is way more sensitive to displacements than surface topography. Topography and displacements are really different terms in interferometry. With Sentinel-1 and its narrow orbital tube (which reduce the perpendicular baseline), height differences of more than 150-200 meters (highly varying) are required to induce a 2\pi shift. From Ramon Hanssen (Radar Interferometry) but also Antonio Pepe (see below), the topography is related to the phase by
\phi_{\mathrm{topo}}=- \dfrac{4\pi}{\lambda}\cdot \dfrac{b_{\mathrm{perp}}}{r\cdot\sin{\theta}}\cdot H
r is the range, H teh height, \theta the incidence angle, … Set the \phi_{\mathrm{topo}} to 2\pi to find the “amount of height” required to produce a 2\pi shift.
H_{2\pi}= -\dfrac{\lambda\cdot r\sin{\theta}}{2\cdot b_{\mathrm{perp}}}
Take theta = 30°, the range of 1000 kilometers (first order approximation) et b_perp of 100 meters, and you’ll need 140 meters of height to produce a 2\pi shift. A hill of few meters high will never induce several cycles in your interferogram. Fortunately for us otherwise we would need digital elevation models with crazy high accuracy to perform DInSAR.
I greatly encourage you to carefully read this review, which helped a lot : Applied Sciences | Free Full-Text | A Review of Interferometric Synthetic Aperture RADAR (InSAR) Multi-Track Approaches for the Retrieval of Earth’s Surface Displacements, and re-do all calculations with the author (p2 to 7 / 39).
Cheers !
Quentin
NB : it seems in your figure that you resampled your interferogram without resampling the real and imaginary components but directly the phase, causing errors in the boundary 0rad/2pi rad (or -pi/+pi).
4 Likes
Dear Quentin,
thank you so much for taking the time to clarify my issue.
My question was indeed not very clear. I referred to the generation of DEMs from InSAR (therefore no topographic phase removal), but this part is what I was looking for.
I already went through this chapter of Hannsen’s work, but found some unclear and contradictive points in other books. I will refer to this equation from now on.
Well observed! Actually, I did not resample at all, simply coregistered (BackGeodocing), created interferogram, debursted, subset, unwrapped. At which step could resampling be (unknowingly) involved?
Glad I could help somehow.
In your subset, if you use geographic coordinates, I am not sure if SNAP takes the closest pixel in your image or if the pixel is interpolated at this very specific geographic coordinates.
To avoid any problem, make sure to select the i and q components and let the interferogram be computed “on the fly” by atan2(q,i).
1 Like
actually, pixel coordinates were used, but a resampling was involved during the Range Doppler Terrain Correction. I should have selected ![]() which writes i+q into the output and then have the phase computed afterwards.
which writes i+q into the output and then have the phase computed afterwards.
I have noticed the lower the coherence (in arid mountainous regions) the more abvious the interferometric fringes. if there is no deformation at all, pixels would perfectly correlate in such situation. I just wanted to understand whether differential InSAR measure decorrelations amongst image pairs or otherwise? Considereing the flat earth phase and the topographic phase were removed.
no deformation is not necessarily linked to high coherence.
An area can have considerably deformation but still be coherent (this is what we need for DInSAR), when the scattering mechanisms remain constant over time and the velocity does not exceed the maximum detectable displacement (limited by the wavelength)
An Area can have no deformation but still be decorrelated when the surfaces change, e.g. melting of snow, growth of vegetation, rotation or slipping mass movements…
1 Like
Help!! plz.
how can I know the nature of the deformation from this interferogram (sagging or the opposite)
Hi Dear
I am working on gully erosion. Previously, I used two Sentinel 1 images in Snap software to calculate displacement. Now I came to the conclusion that Gali does not move and I have to do a topographical analysis. How to calculate the topography analysis for two different years? Then get the erosion