I am working on subsidence monitoring. So I want to produce a displacement map. Steps I have taken:
S1 TOPS split
Apply orbit file
S1 Backgeocoding
Interferogram Formaiton
S1 TOPS Deburst
subset
Multilooking
GoldStein Filtering
Unwrapping
Phase to displacement
Range Doppler terrain correction
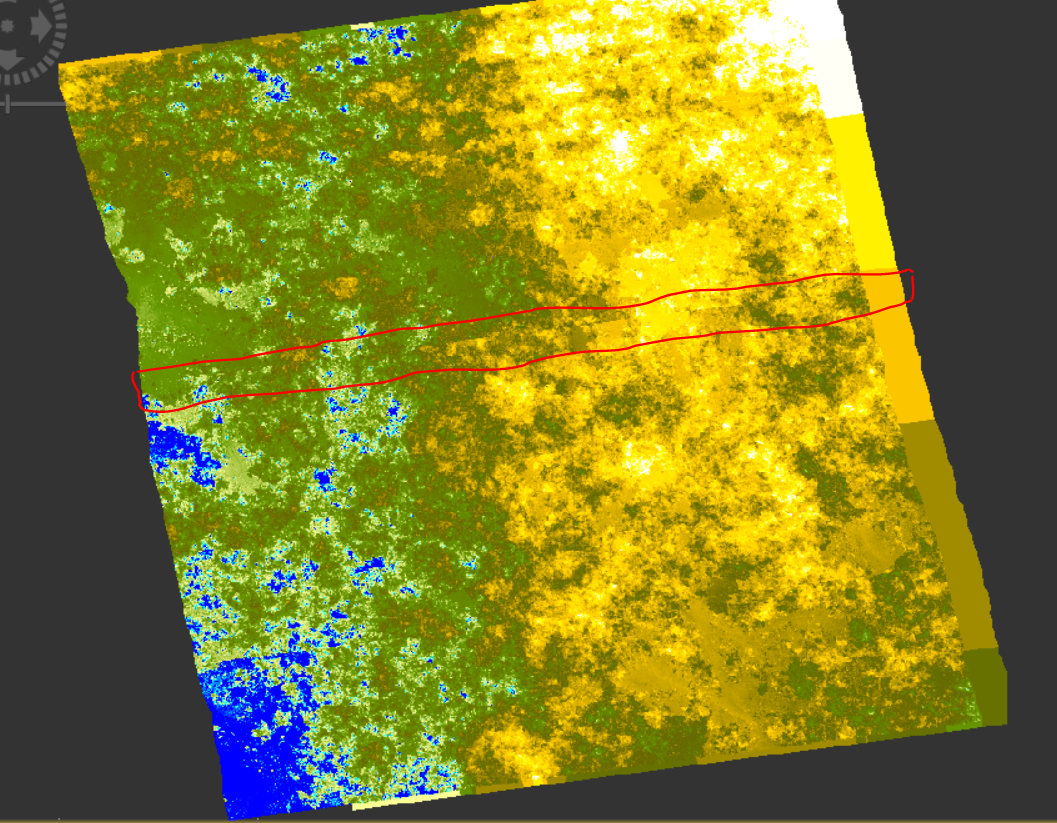
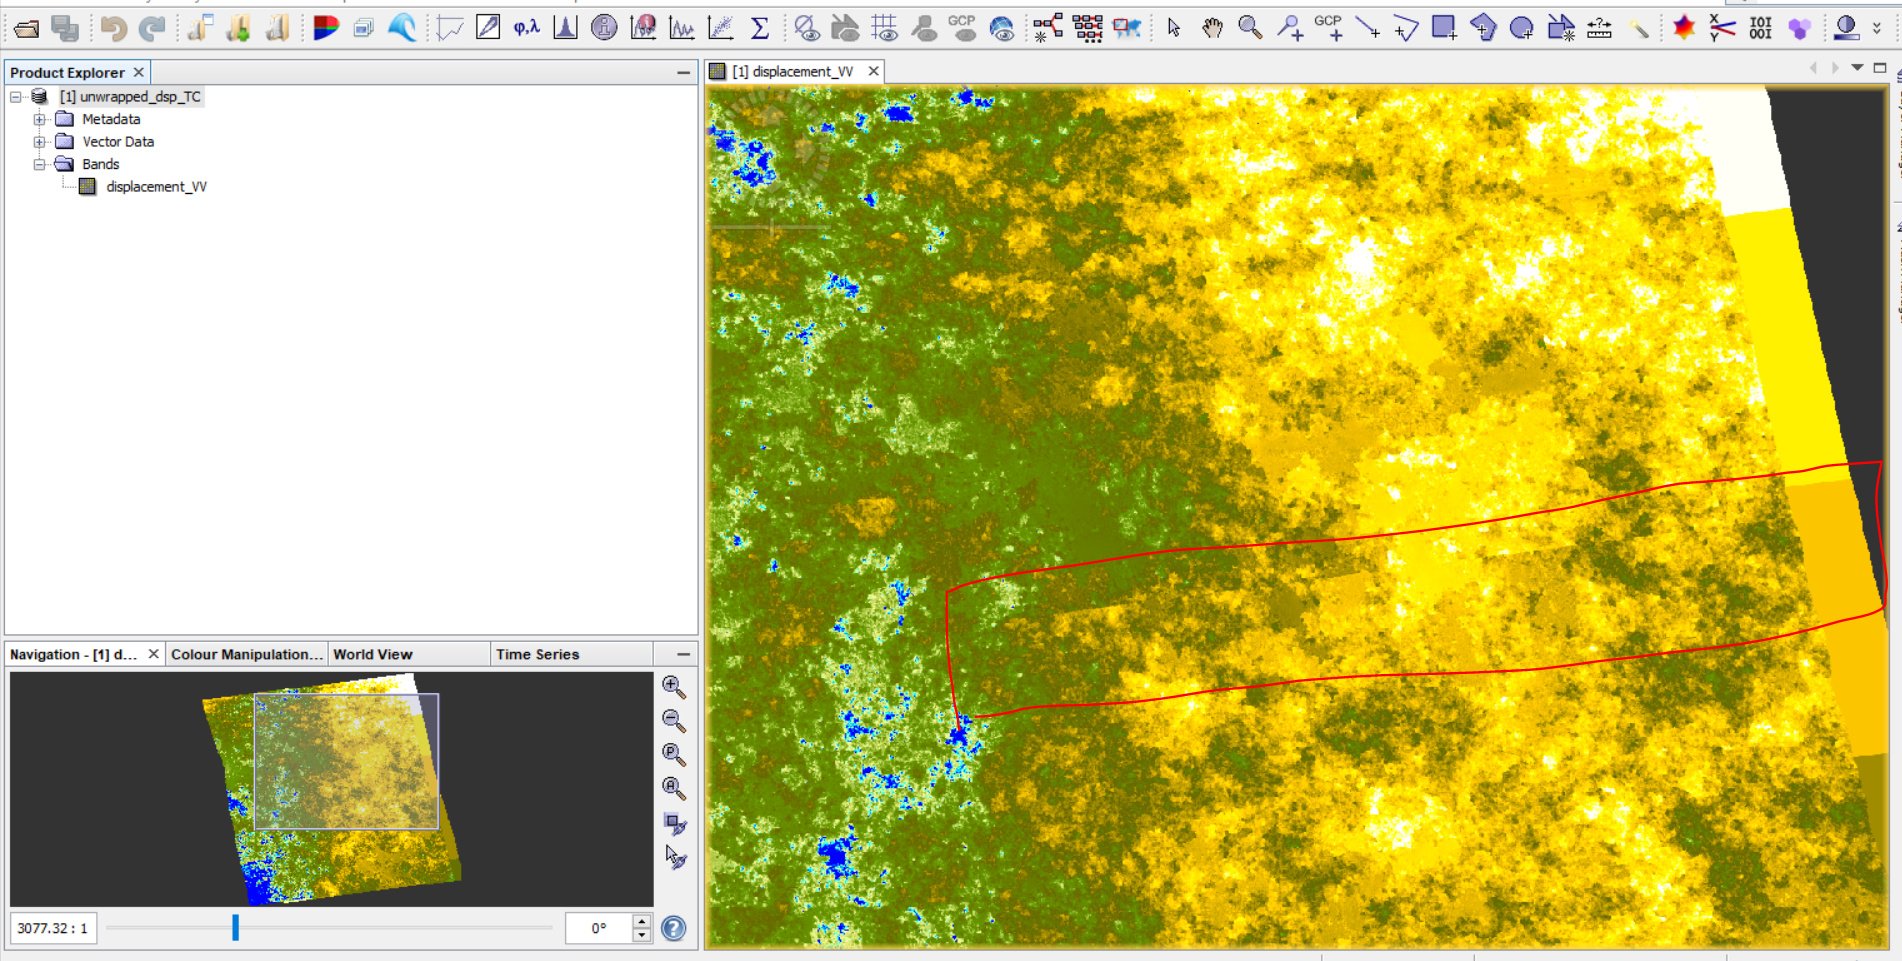
But I guess after creating an interferogram, some errors occur in the phase band. Therefore, the displacemet map is erroneous.
I added a few pictures to make it better understood.
Can anyone help if they know why the problem is happening please?
these sharp lines are probably introduced during the unwrapping. Please make sure you have a sufficient number of overlap pixels (200 are recommended), in the snaphu export.
Besides that - the result looks heavily affected by decorrelation. As the displacement pattern propagates in range direction (from left to right) it is very likely that a ramp has been introduced during the unrwapping as a result of phase noise. Is there a chance to find an image pair which is more suitable?
I can find the new image pair but what should I consider when choosing these images? Are the perpendicular baseline value important? For example, I selected the Perpendicular baseline value less than 50 in this data.
small perpendicular baselines are good for differential interferometry, but the reduction of atmospheric phase contributions is equally important. Try to use images with short temporal baselines and from the dry season to avoid that one or both images were acquired during a rainfall event.
In the end, when you have much vegetation on the ground, you lose most of your phase information to decorrelation.
I will try to select the data again according to the recommendations you gave, Thanks a lot. Actually, I’m a little new to SAR so I didn’t fully understand the decorrelation. Why is decorrelation so important and how do I know if the result is affected by decorrelation?
you can only retrieve reliable information from InSAR when the waves of both signals are “in-phase”, that means if they were received from the same scattereing mechanisms on the ground. If a surface changes between the first and second image (e.g. movement of a tree canopy, growth of crops), this is no longer the case and your signal is out-of-phase, resulting in a decrease of coherence. That is why we look at the coherence band as an indicator for the phase quality. It sould be bigger than 0.4 for large parts of the area you want to analyze, otherwise the interferogram is likely to contain noise which does not represent the actual surface condititions. As a result, the unwrapping will give you a quite random or heavily distorted result (as the ramp in your image).