I see no issue with the second images.
Maybe you need to consider the tip @gnwii wrote.
The colour stretching can be different for a subset. Check the maximum and minimum values.
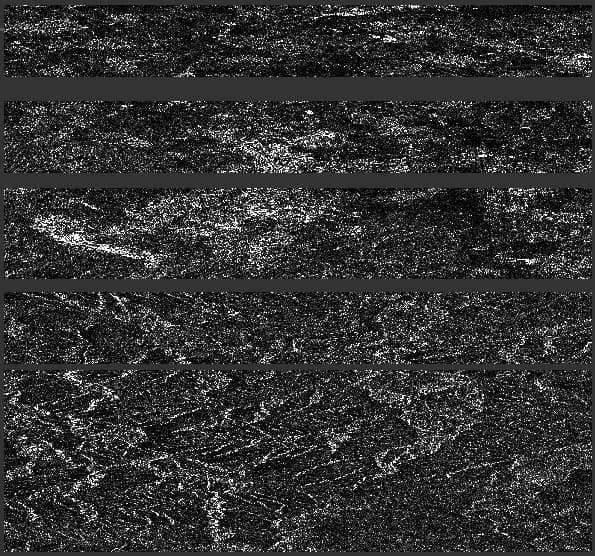
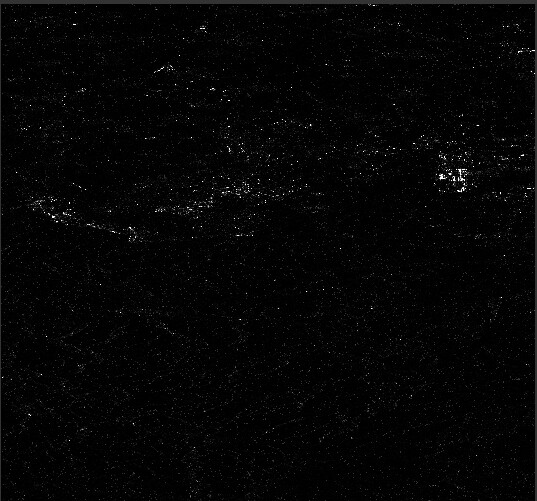
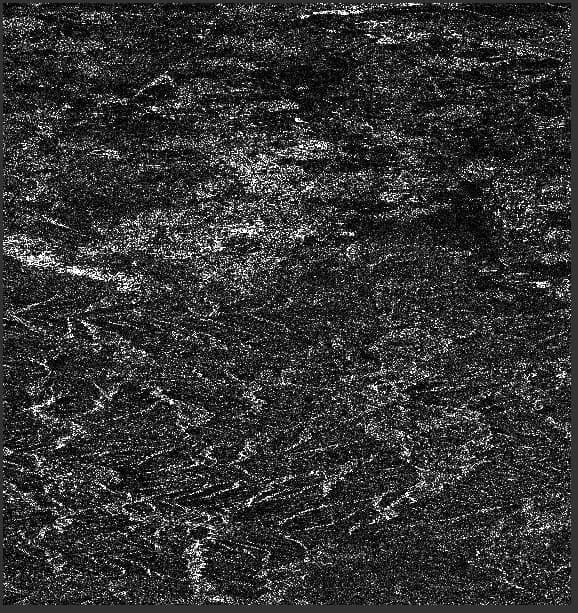
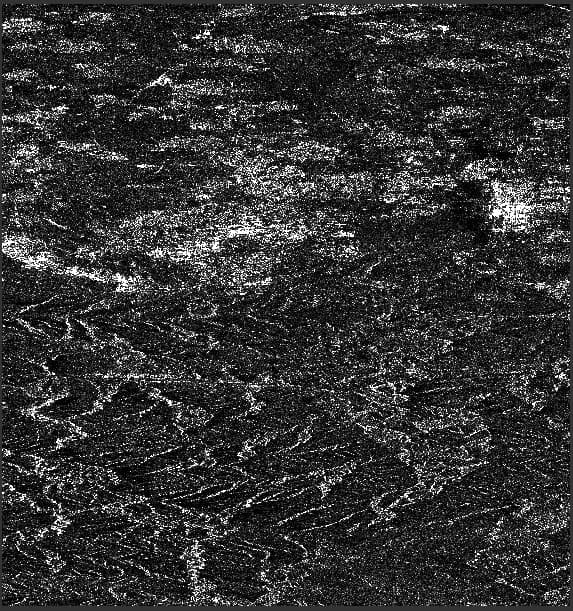
Yes, in the four figures shown above, the last two are normal and they are also the results I want. My confusion is that after I use gpt command to crop the same area, I get the result as shown in the first two pictures. In the first image, some bands of varying spacing appear, and the entire image appears to be segmented. Logically speaking, for the same area, the result of using the gpt command and clicking with the mouse in SNAP should be the same.
Ah, okay. Now I understand. The results are different when you do the subset operation in SNAP Desktop and with gpt.
The result of gpt is good but in the desktop app you get the wrong results.
Hi, Marco! Thank you very much for your attention to my problem.
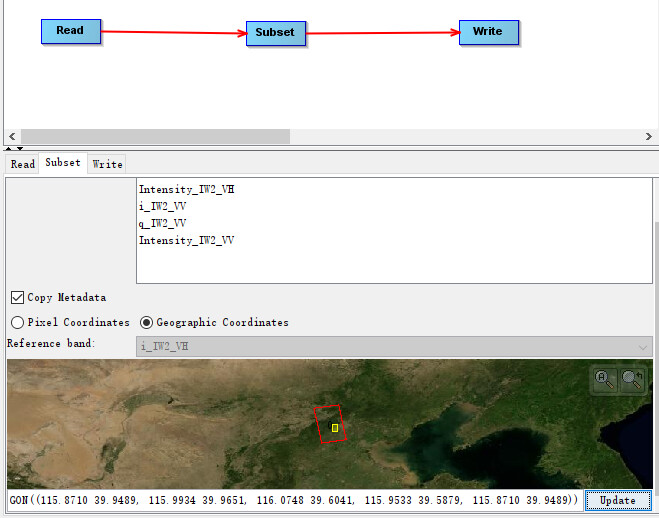
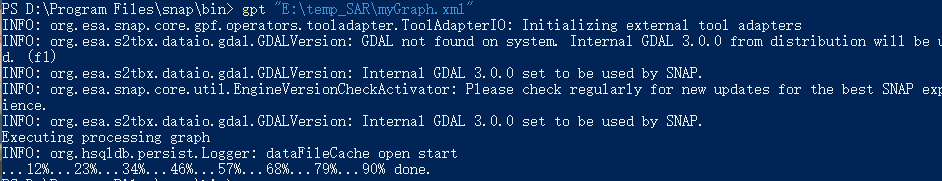
Today I tried another method. I built a graph in SNAP Desktop and saved it as .xml, then I loaded and executed the file with gpt command and got normal results.