I have been working with GRD data from the sentinel-1 satellites for the last few months.
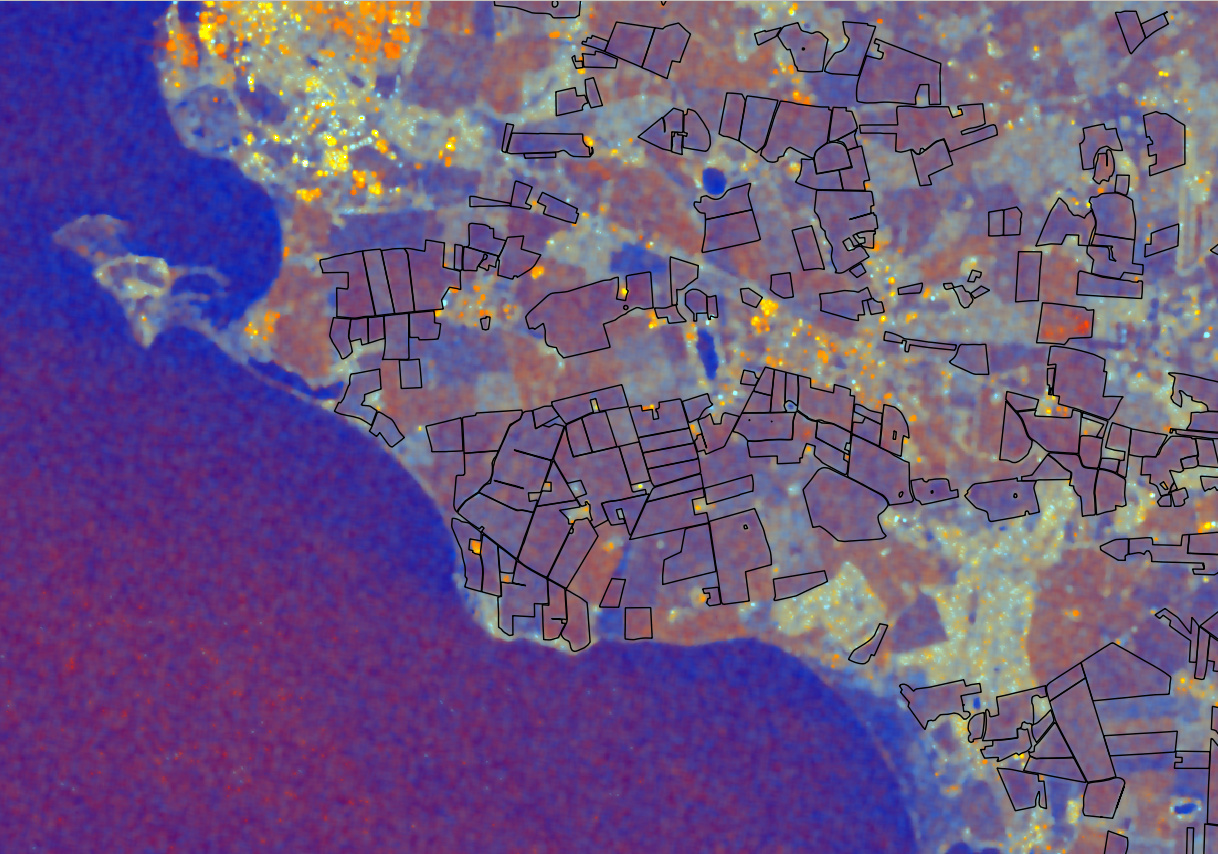
I am trying to work with winterwheat fields in the area in the pictures, to monitor crop growth.
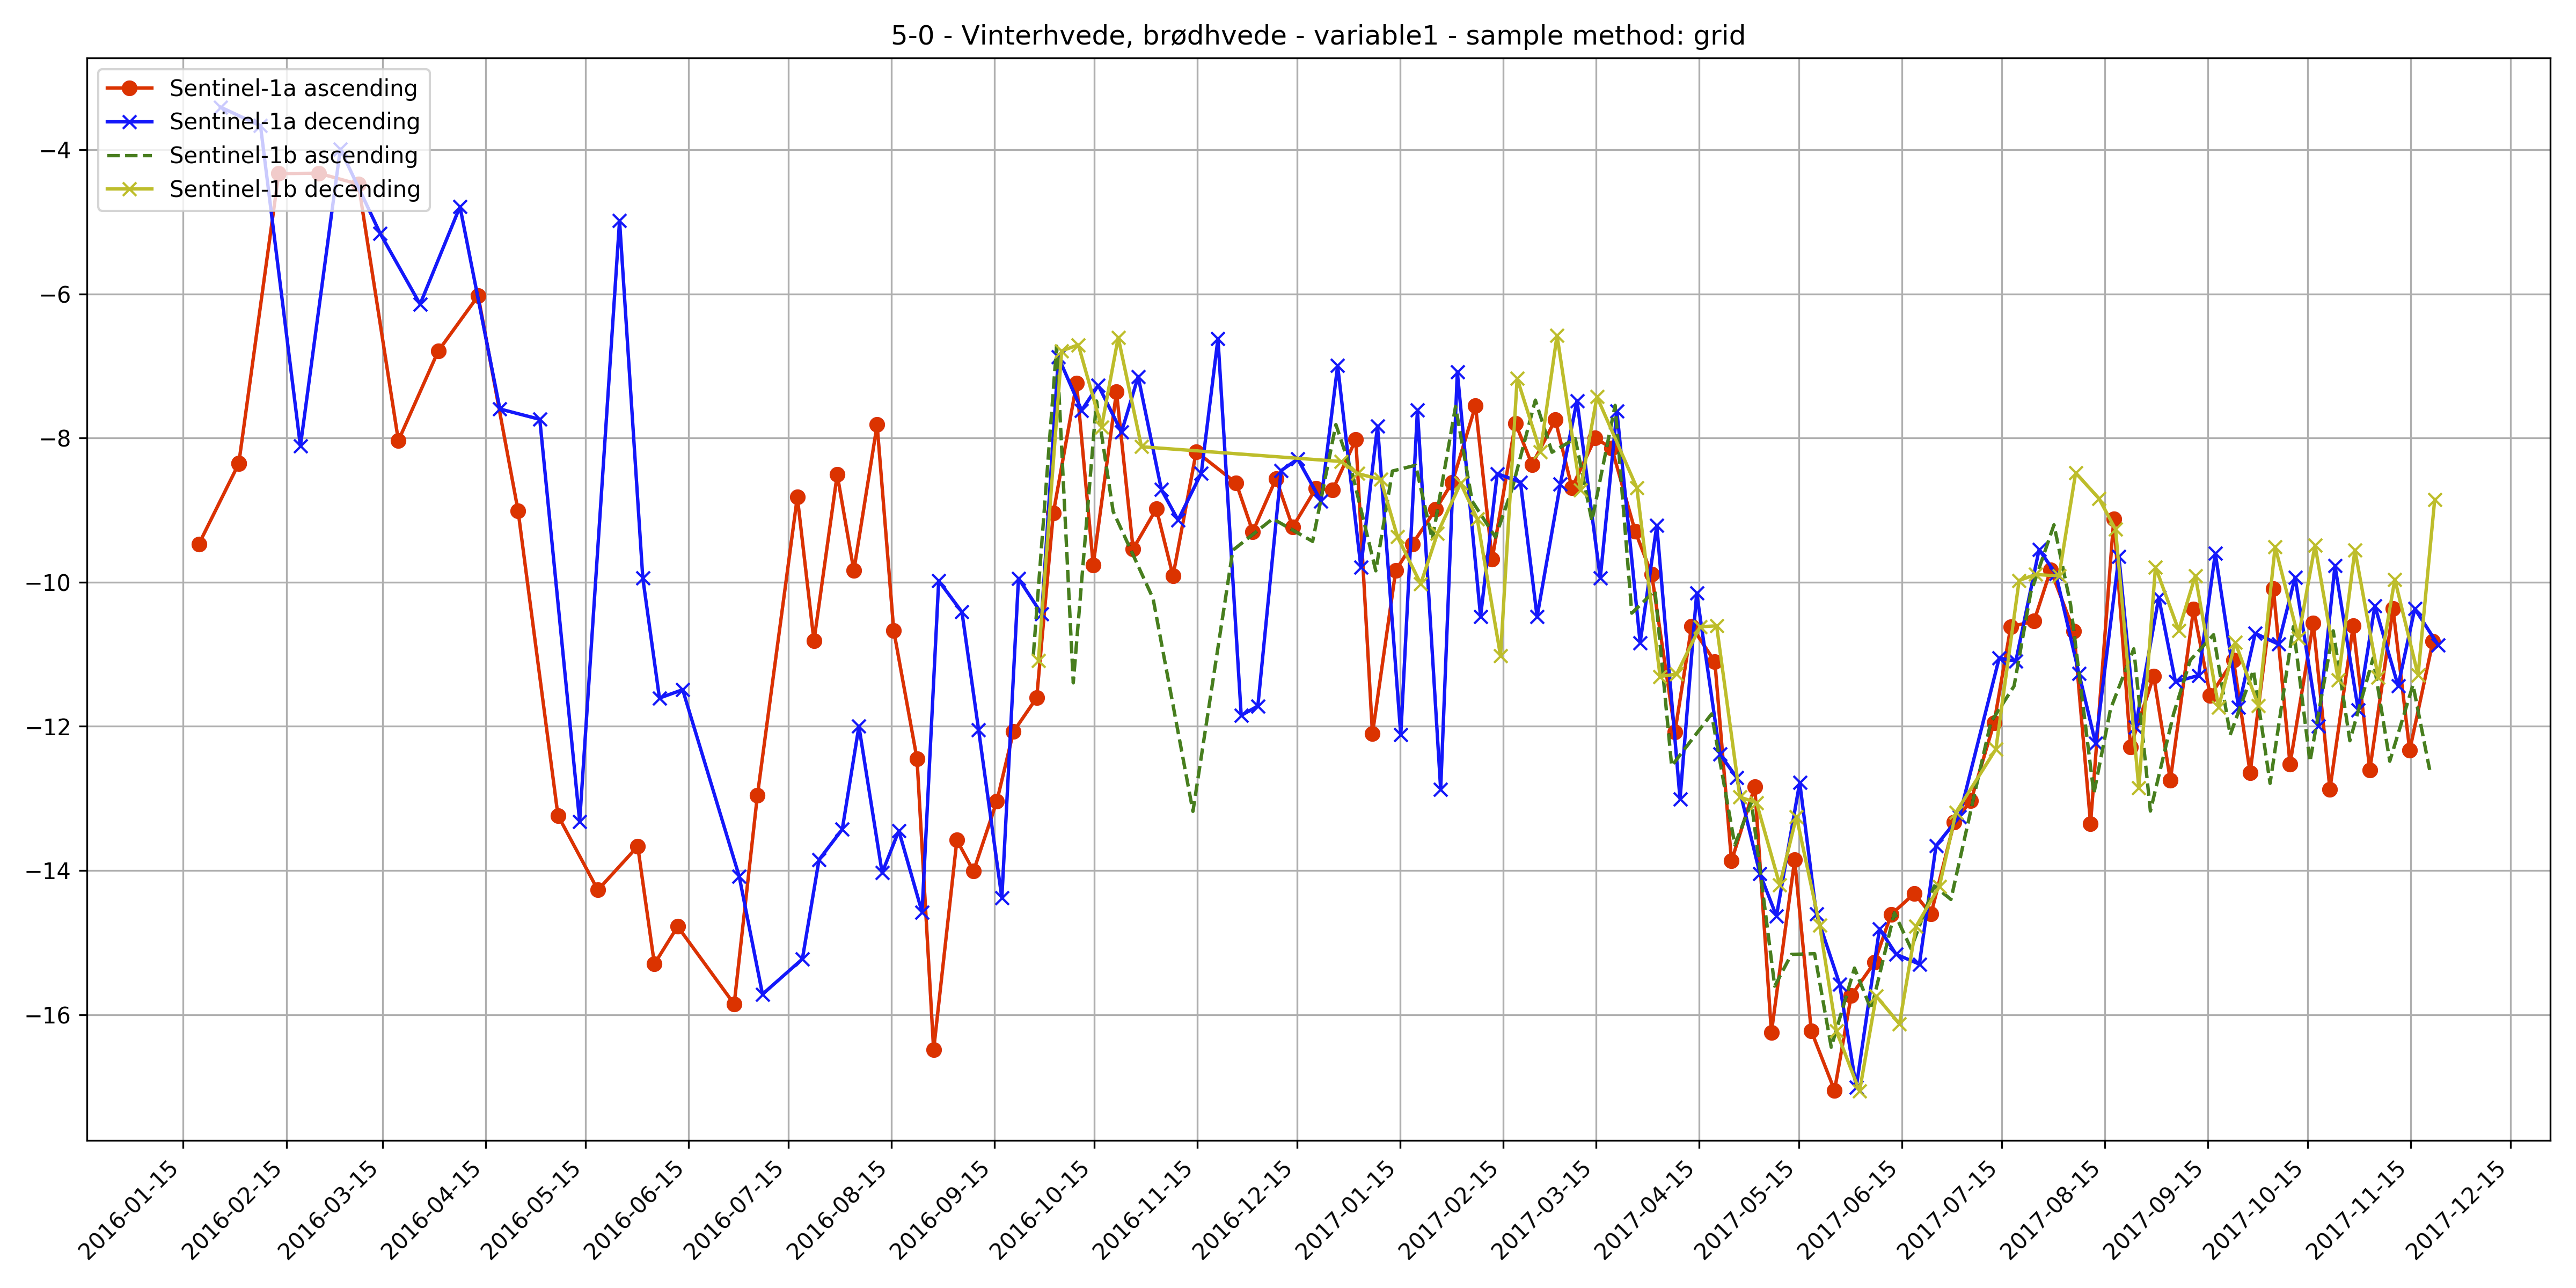
One of the things that confuse me is the sudden changes in the output I get on scans that a close in terms of time.
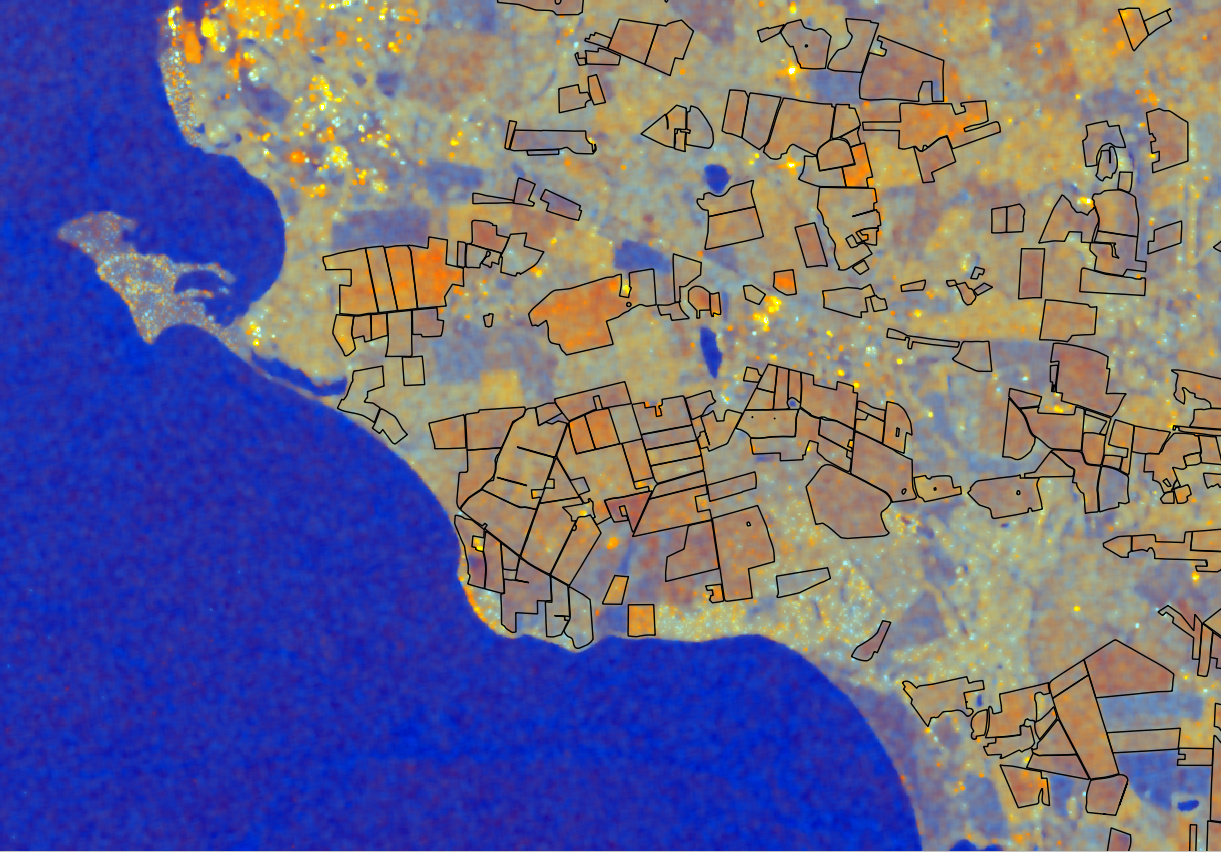
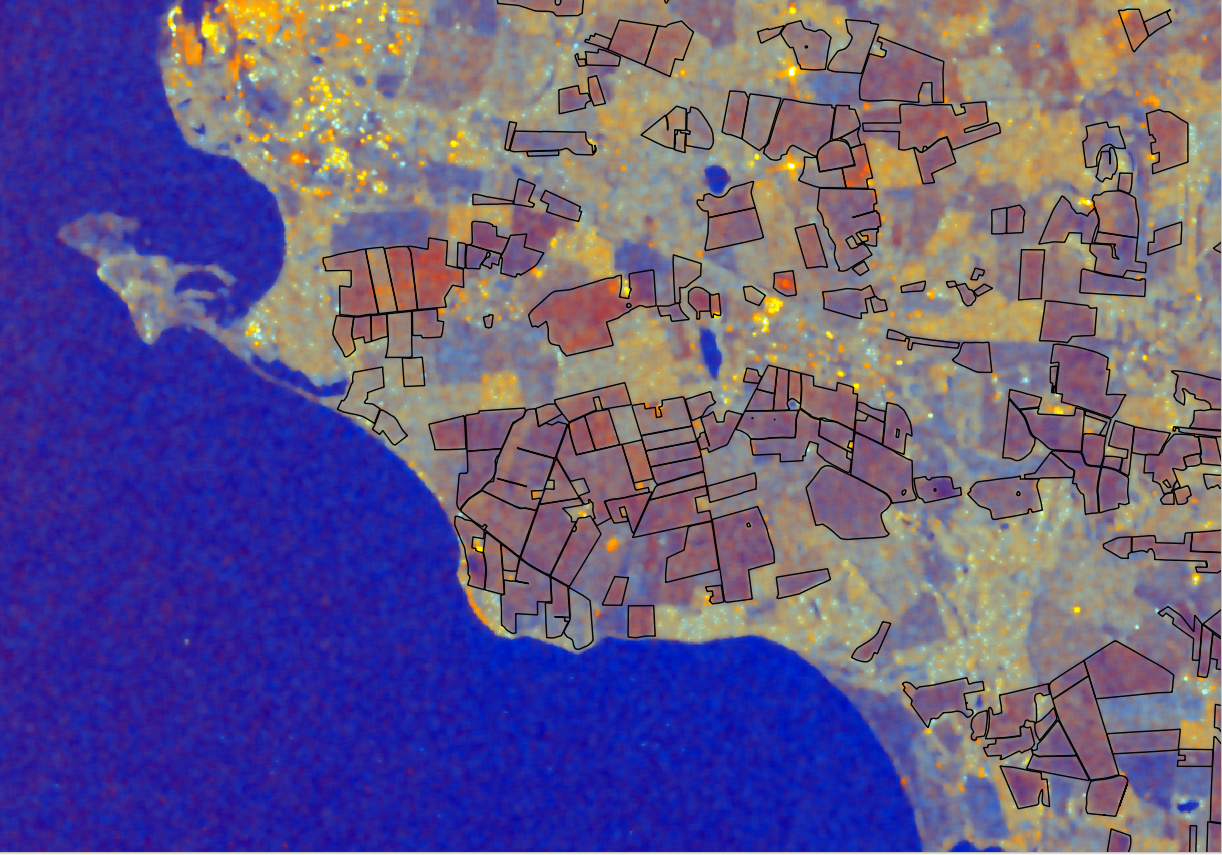
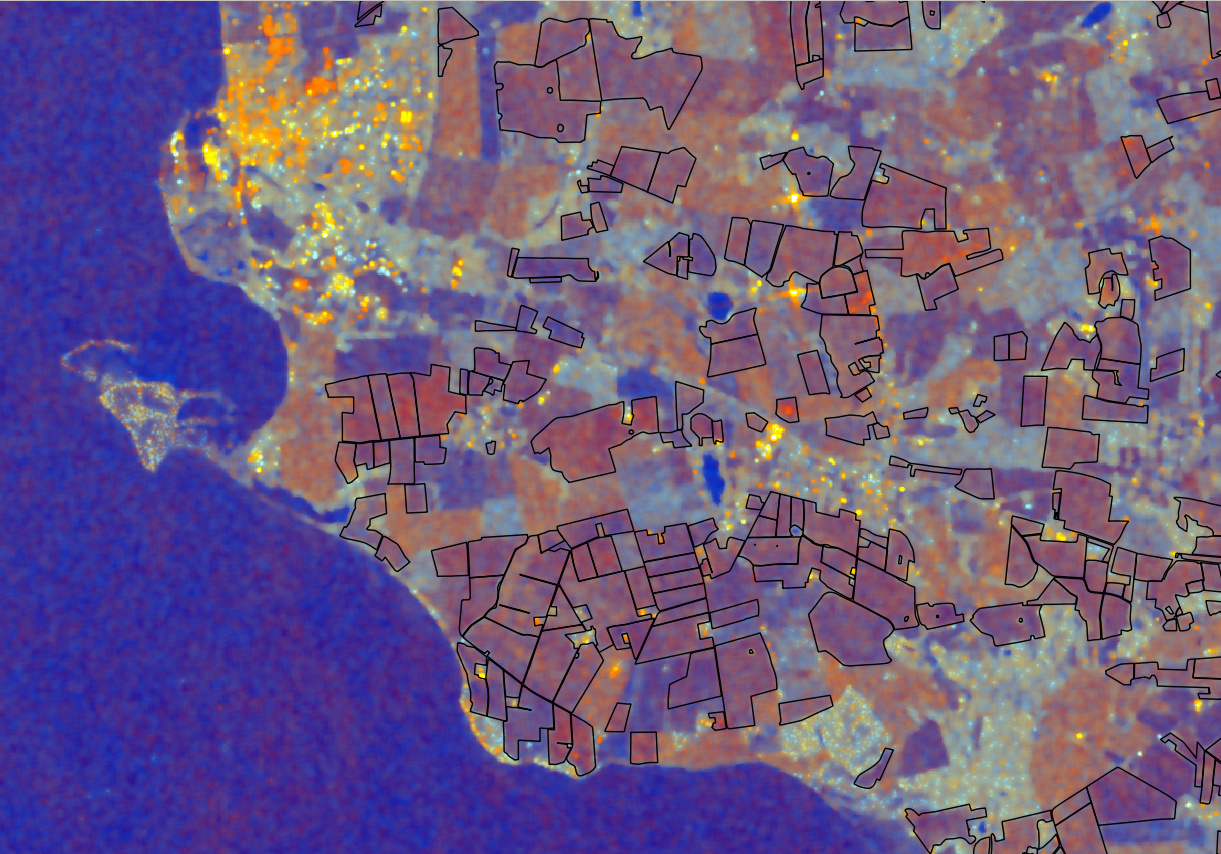
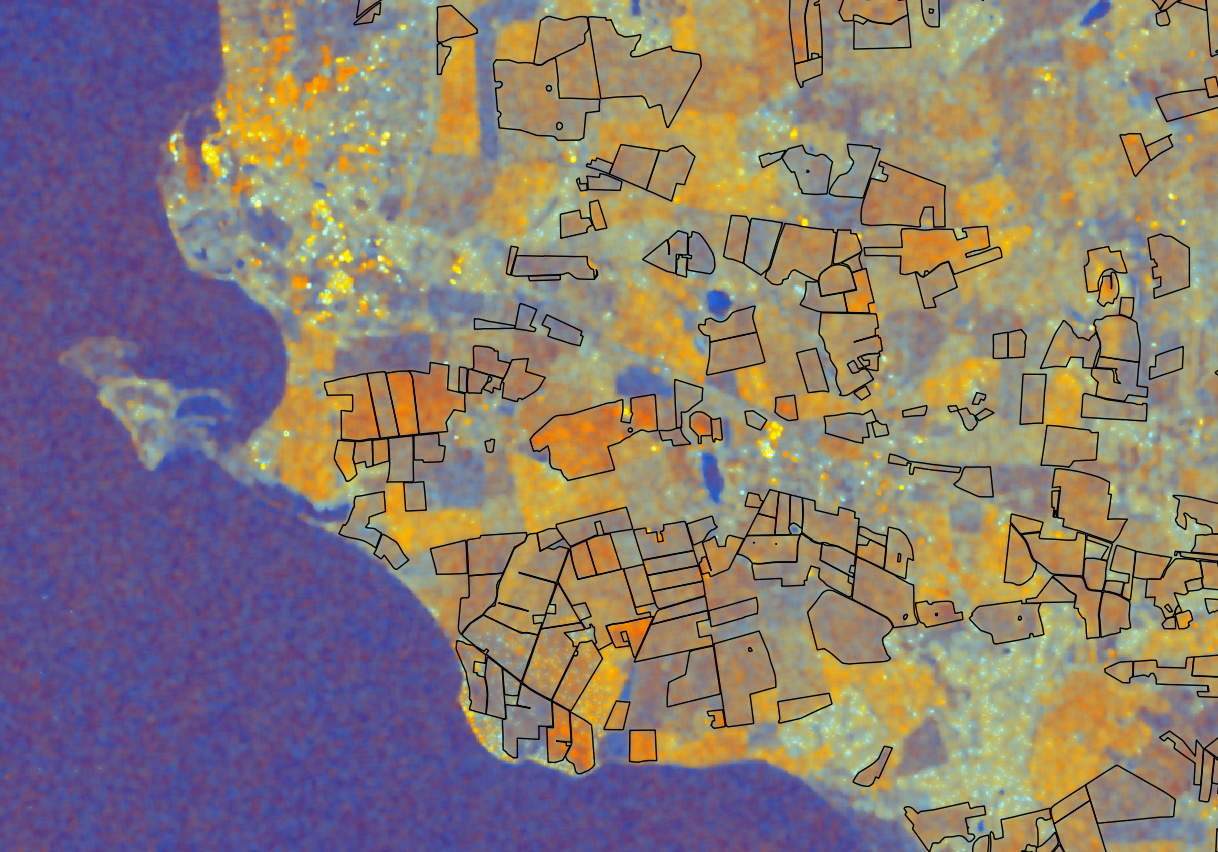
The images in the two columns repressents some examples, in the first collum the std scenario I encounter
and in the second collum the uncommon scenario I see.
Red colour represents Sigma0_VV_db, green Sigma0_VH and blue Sigma0_VV/Sigma0_VH. All images are set to the same colour range. The date for the images in the same row are onlytaken a few day in between.
I use the procedure
Calibration
Speckle filter (Lee sigma)
Terrain correction
I have tried sort/filter the data based on:
-ascending/descending orbit
avg_scene_heigh
incidence_near
incidence_far
But even when groping this scenario is present, for scans close in terms of time(4-5 days).
I have also tried “S-1 Termal Noise Removal”, but it did not seem to have an impact on the above scenarios.
So I am trying to understand why I see these changes in the GRD data.
If possible, it would also be nice to have a way, to either detect or compensate for these sudden changes.
sorry if I understand you wrong, but if they are 4-5 days apart, they inevitably have different looking directions or incidence angles? These might lead to different backscatter, especially for agricultural fields.
Did you also compare images of exact same track, thus having temporal baselines of 6, 12, 18, 24… days?
Soil and vegetation moisture affect the signal a great deal. You should check weather data and see if you can correlate wet conditions with backscatter variations.
Thank you for responing to my questions.
Sorry for my late response, but had some computer problems.
No, I did not do sorting based on the temporal baseline.
But, this was bassicly what I was looking for in terms what parameters could impact the output.
I am not sure if normalization to a pre-defined incidence angle would help and how this is operation can be performed directly in SNAP.
I found a few references:
But they seem to do the operation externally and not in SNAP.
I will try determine if I can do some kind normalisation directly in SNAP,
so my output plot results end up being less noisy:
Since it would be nice to ensure that the I could use all the scan collected with the sentinel-1.
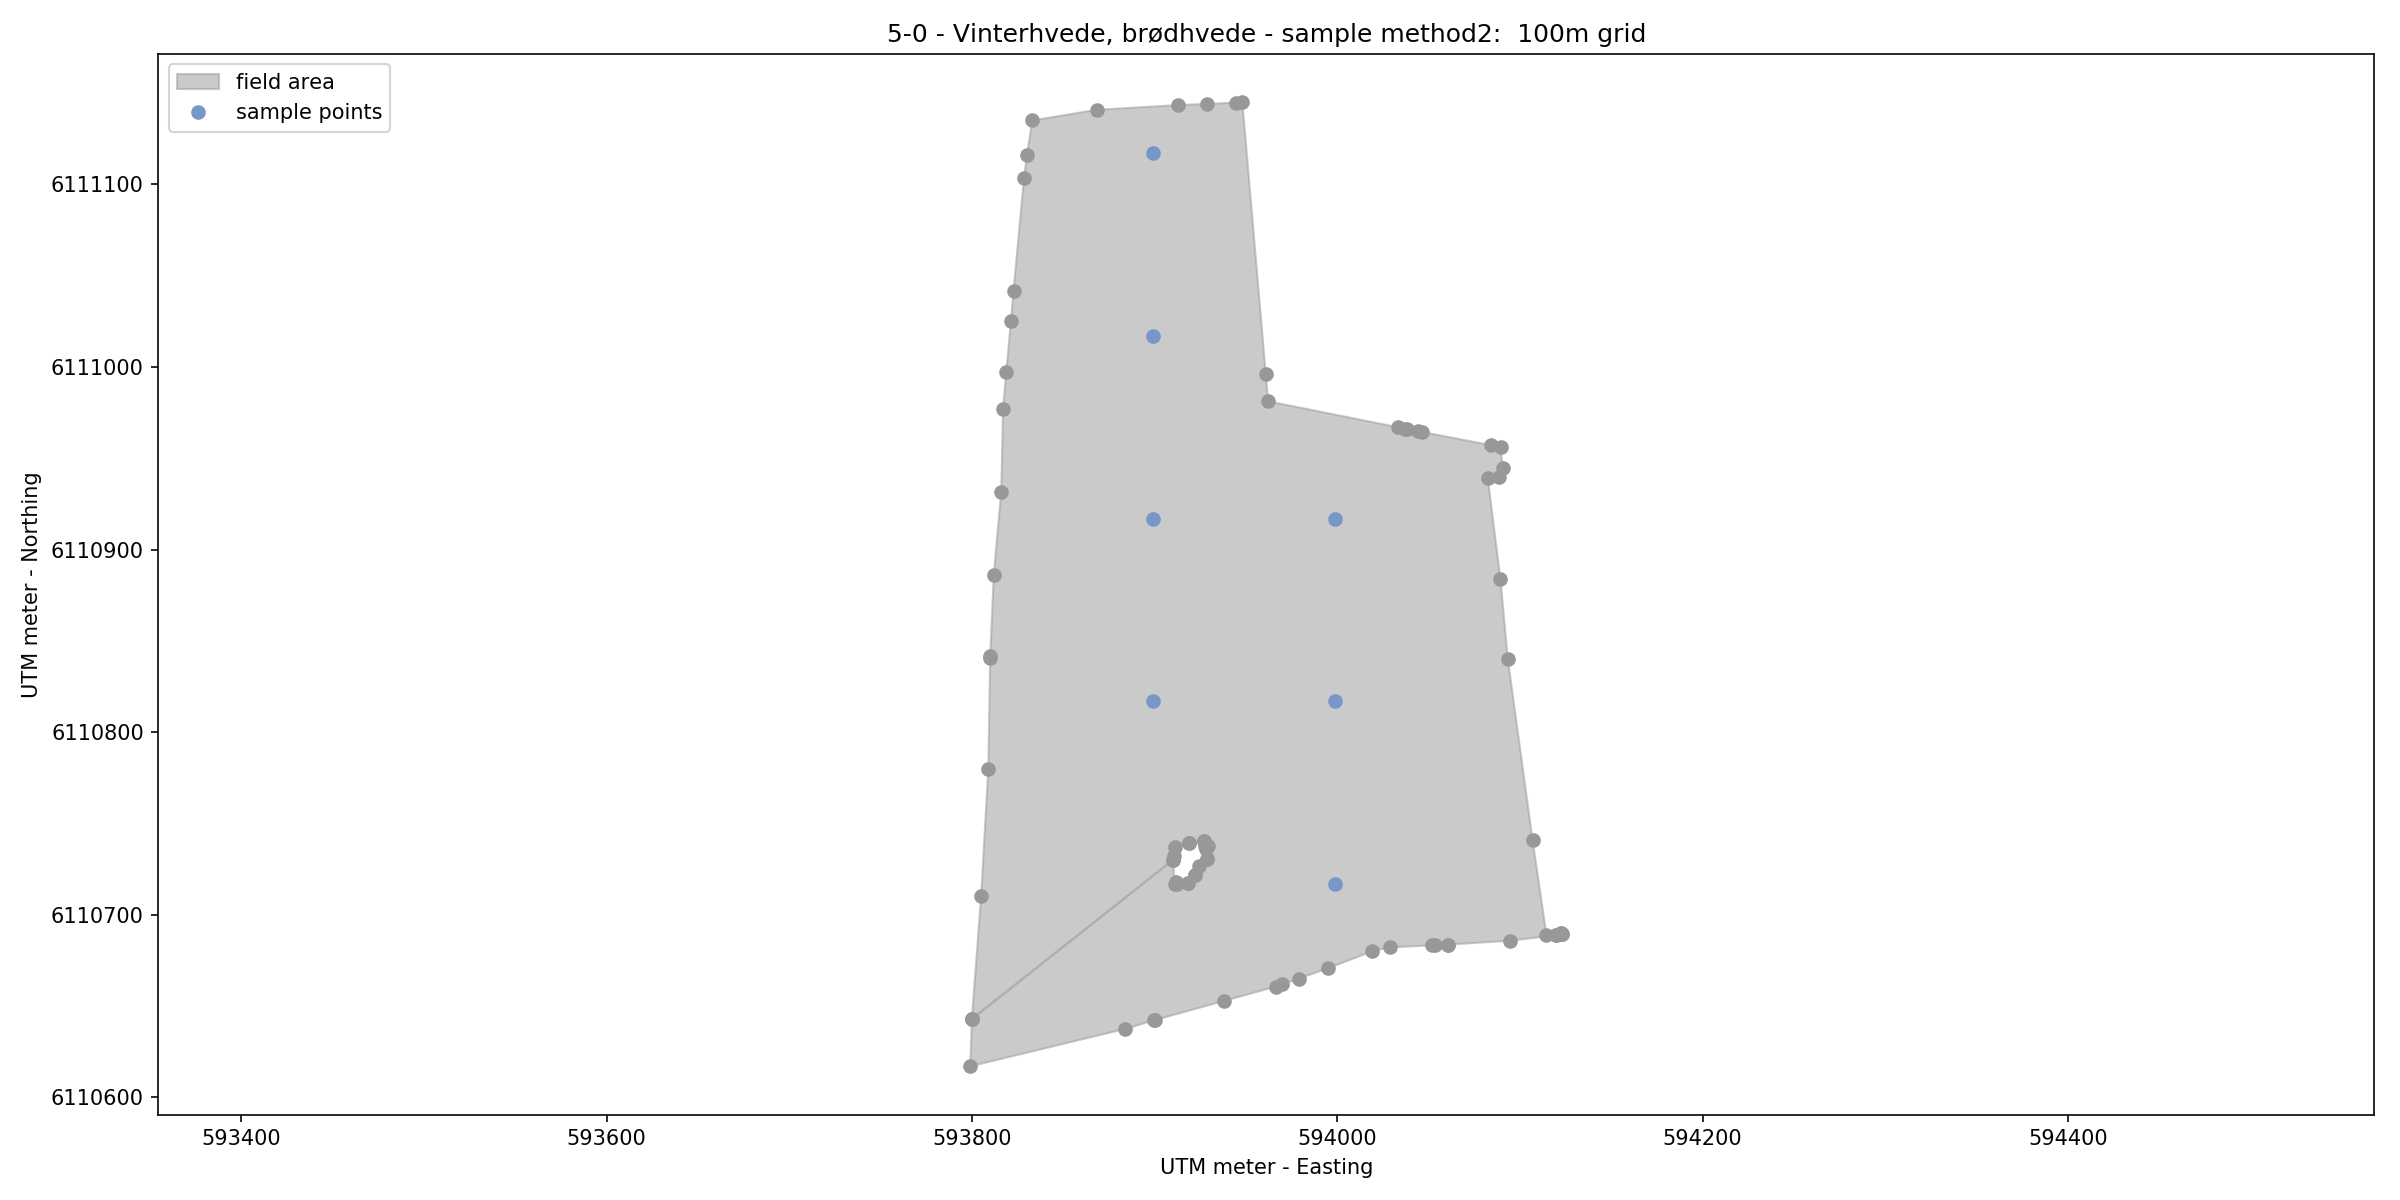
I’m not convinced indidence-angle effects are to blame. If you want to have less (speckle) noise, average over the whole field or around your sample points instead of using the value of just 7 pixels in your plot.
I get your point on averaging the whole field.
But the effects are still the somewhat the same.
I used a bit of time experimenting to find an okay grid size for this specific farmer so that I could do rapid sampling.
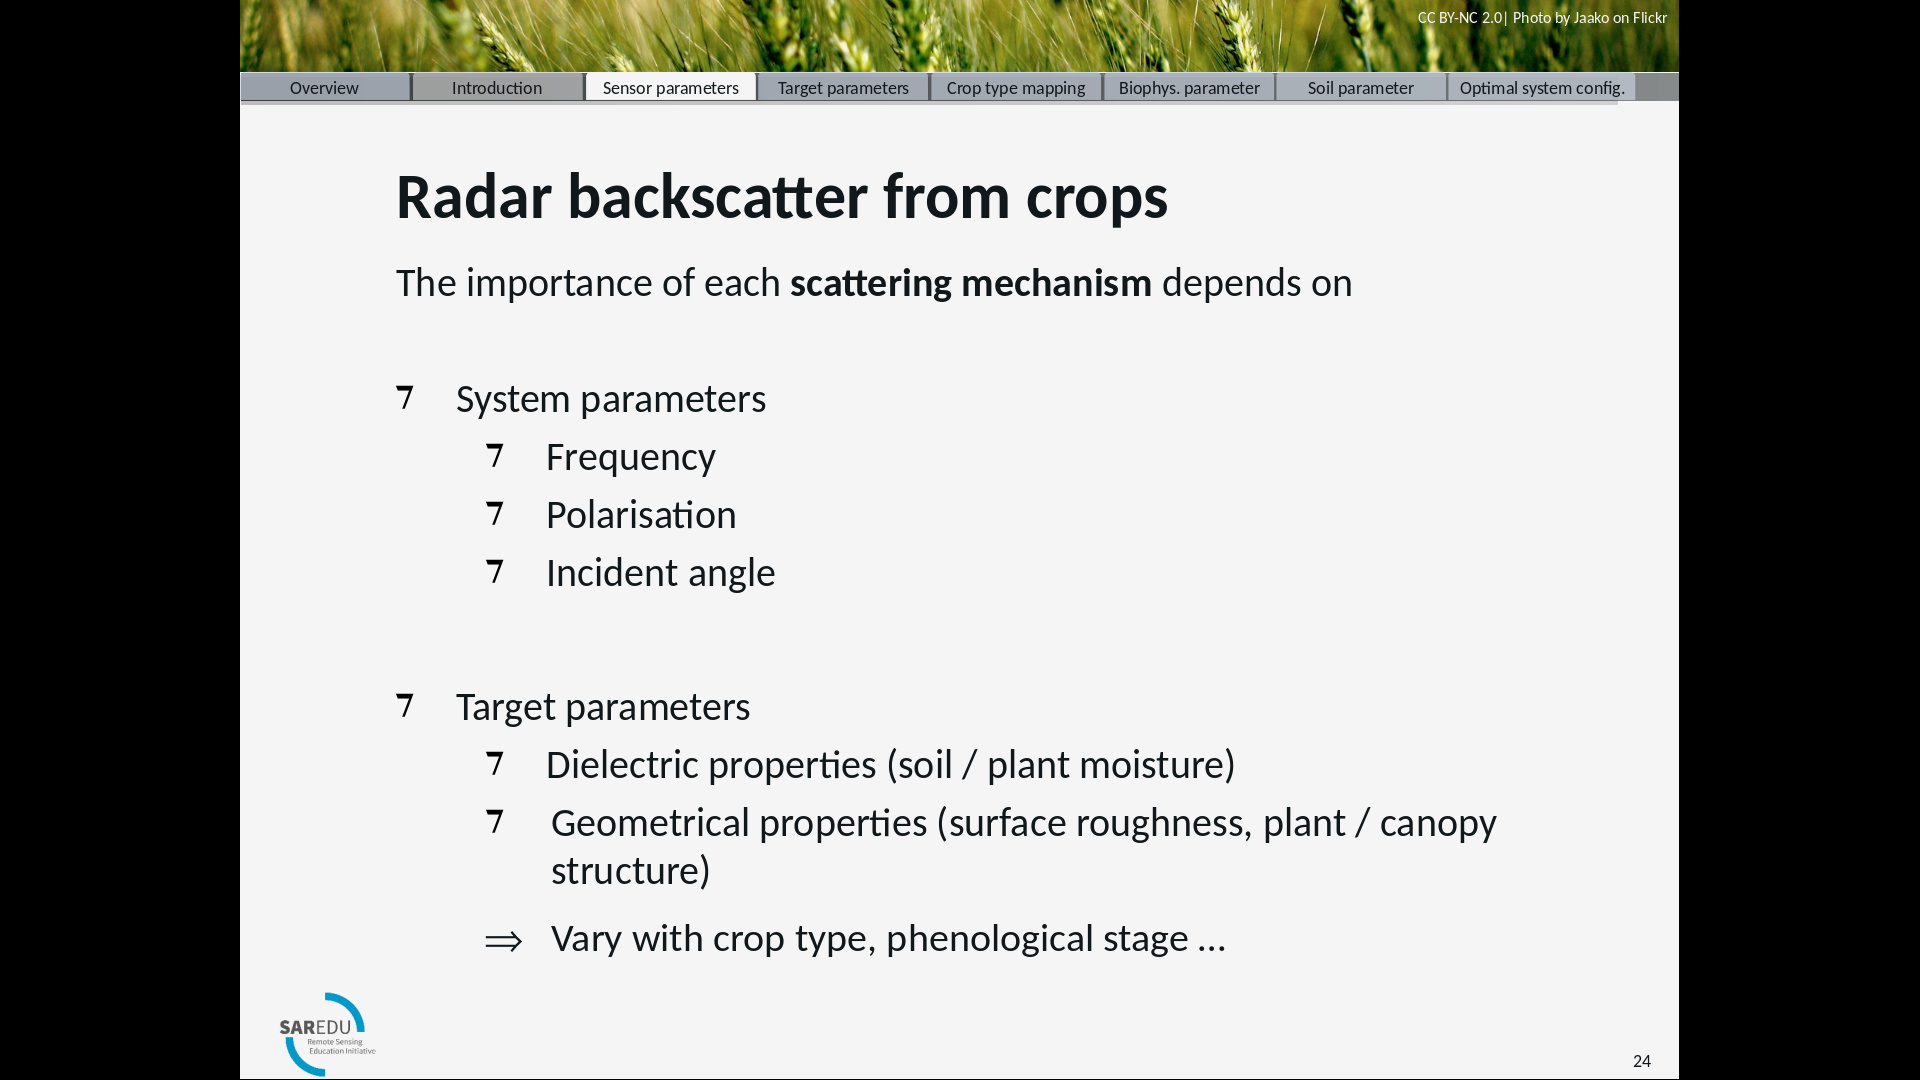
Anyway, I was trying to become smarter on what factors from the sentinel -1 sattelits impacts the results for a field.
In the literature I have been able to find, incident angle also seems to be a relevant factor.
In this case the frequncy is lock for to the C-band.
I am not claiming that is will improve my result to compensate for thee factor.
But I think it is better to attempt to analyse what impact each factor from the sentinel-1 has on my result than just ignoring it. Mostly this has to do with my understanding of the problems I am working with.
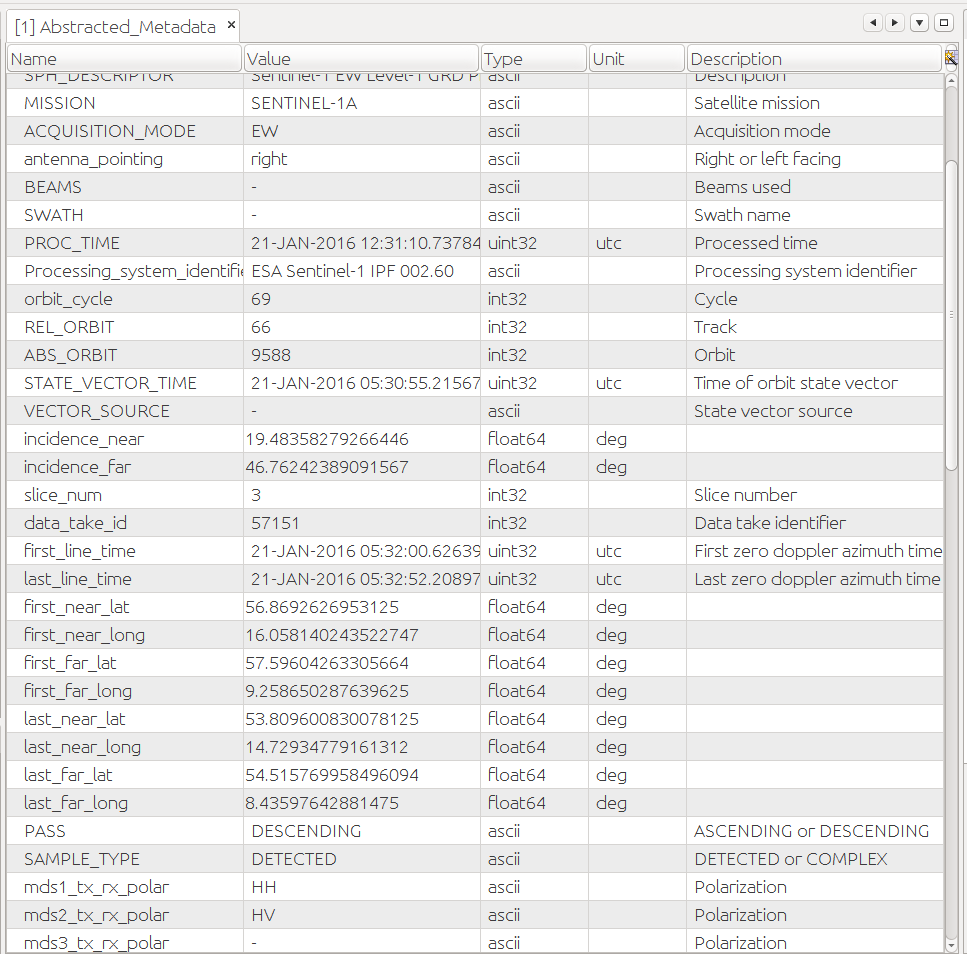
So I am still trying to understand all the parameters in a scans metadata and what they are used for:
When I have an overview of sentinel factors, I will start including external factors. These external factors could be rain, temperature, soil type, soil info, field seeding, field harvesting and other farm operation info.
I am still trying to determine how to perform the compensation directly in SNAP.
So do you have any hints on how this is done?
Also, do you have ideas on other factors that could impact my result?
You can do radiometric terrain flattening to reduce the effect of slope and local incidence angle. Just keep in mind that since the scattering from a resolution cell or a field can be directional, you should not expect that doing all the possible corrections will give you a dataset where observation-angle and -direction do not matter at all.
Thank you very much for the response to my questions.
I will keep in mind the challenges you talk about and see what result I get. Based on the name it was unclear that “radiometric terrain flattening” would be able to perform this task.
Most of DK is rather flat, so I was not expecting it to be relevant, but I will give it a try and see what impact it has on the result.
Thank you very much for the feedback on my challenges.