I have taken 9 images of my study area & have created 8 interferograms among them. I want to create a stack which will contain the masked displacement products. When I tried to create a stack it excluded the mask.
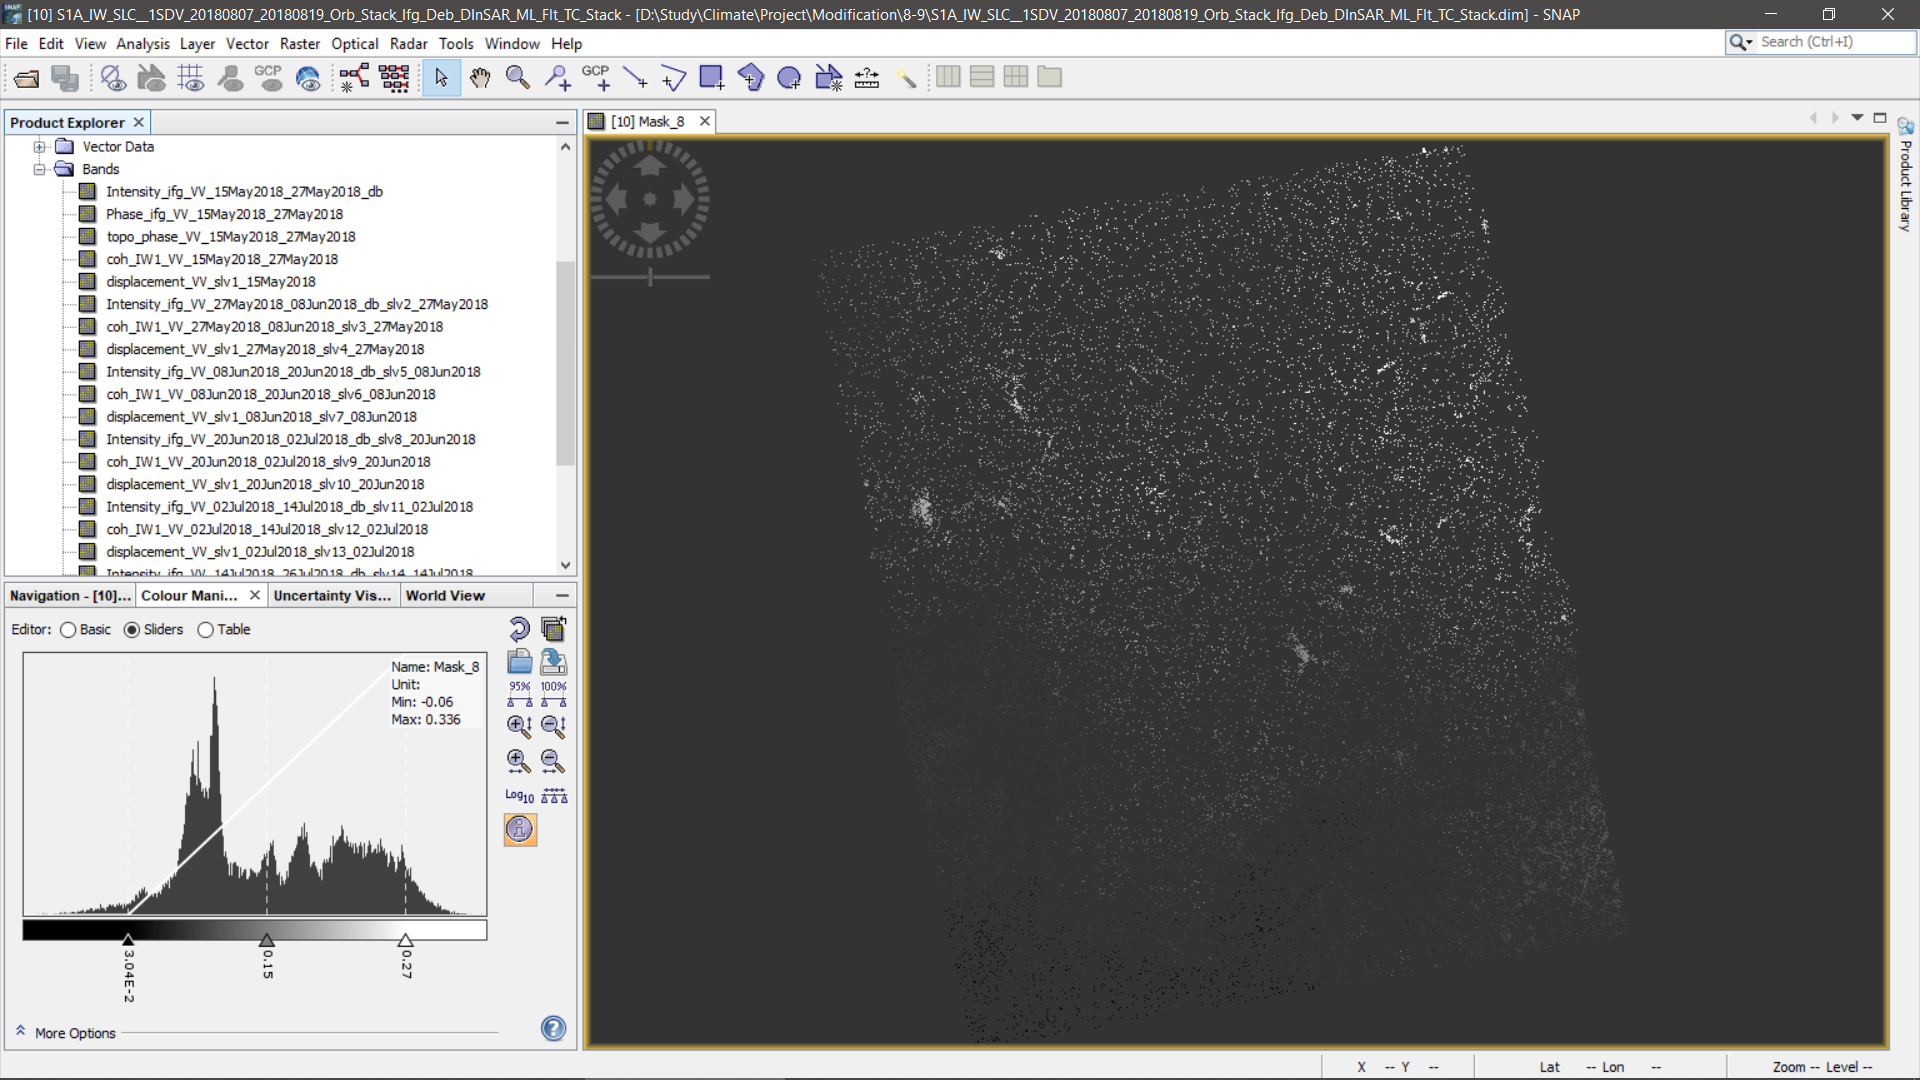
sorry to say, but if this is what is left after masking low coherence, chances are likely that the unwrapping produced incorrect results. If you have checked the quality of the interferograms, feel free to continue.
Masks are not part of the Bands section in the product and therefore often neglected in operators.
But as you still have all coherence bands, you can re-create the masks in the new product or even create an ultimate mask based on all coherences in total. This can be done in two ways:
- calculate an average coherence: (coh1+coh2+coh3+coh4+…+cohn)/n
- create a conditional mask based on all coherence bands: IF coh1 > 0.1 AND coh2 > 0.1 AND… THEN 1 ELSE 0 (must make sure to select a lower threshold, otherwise you will mask out all available pixels)
when I tried the second way & tried to mask out all the coherence values less than 0.4, I got this error.
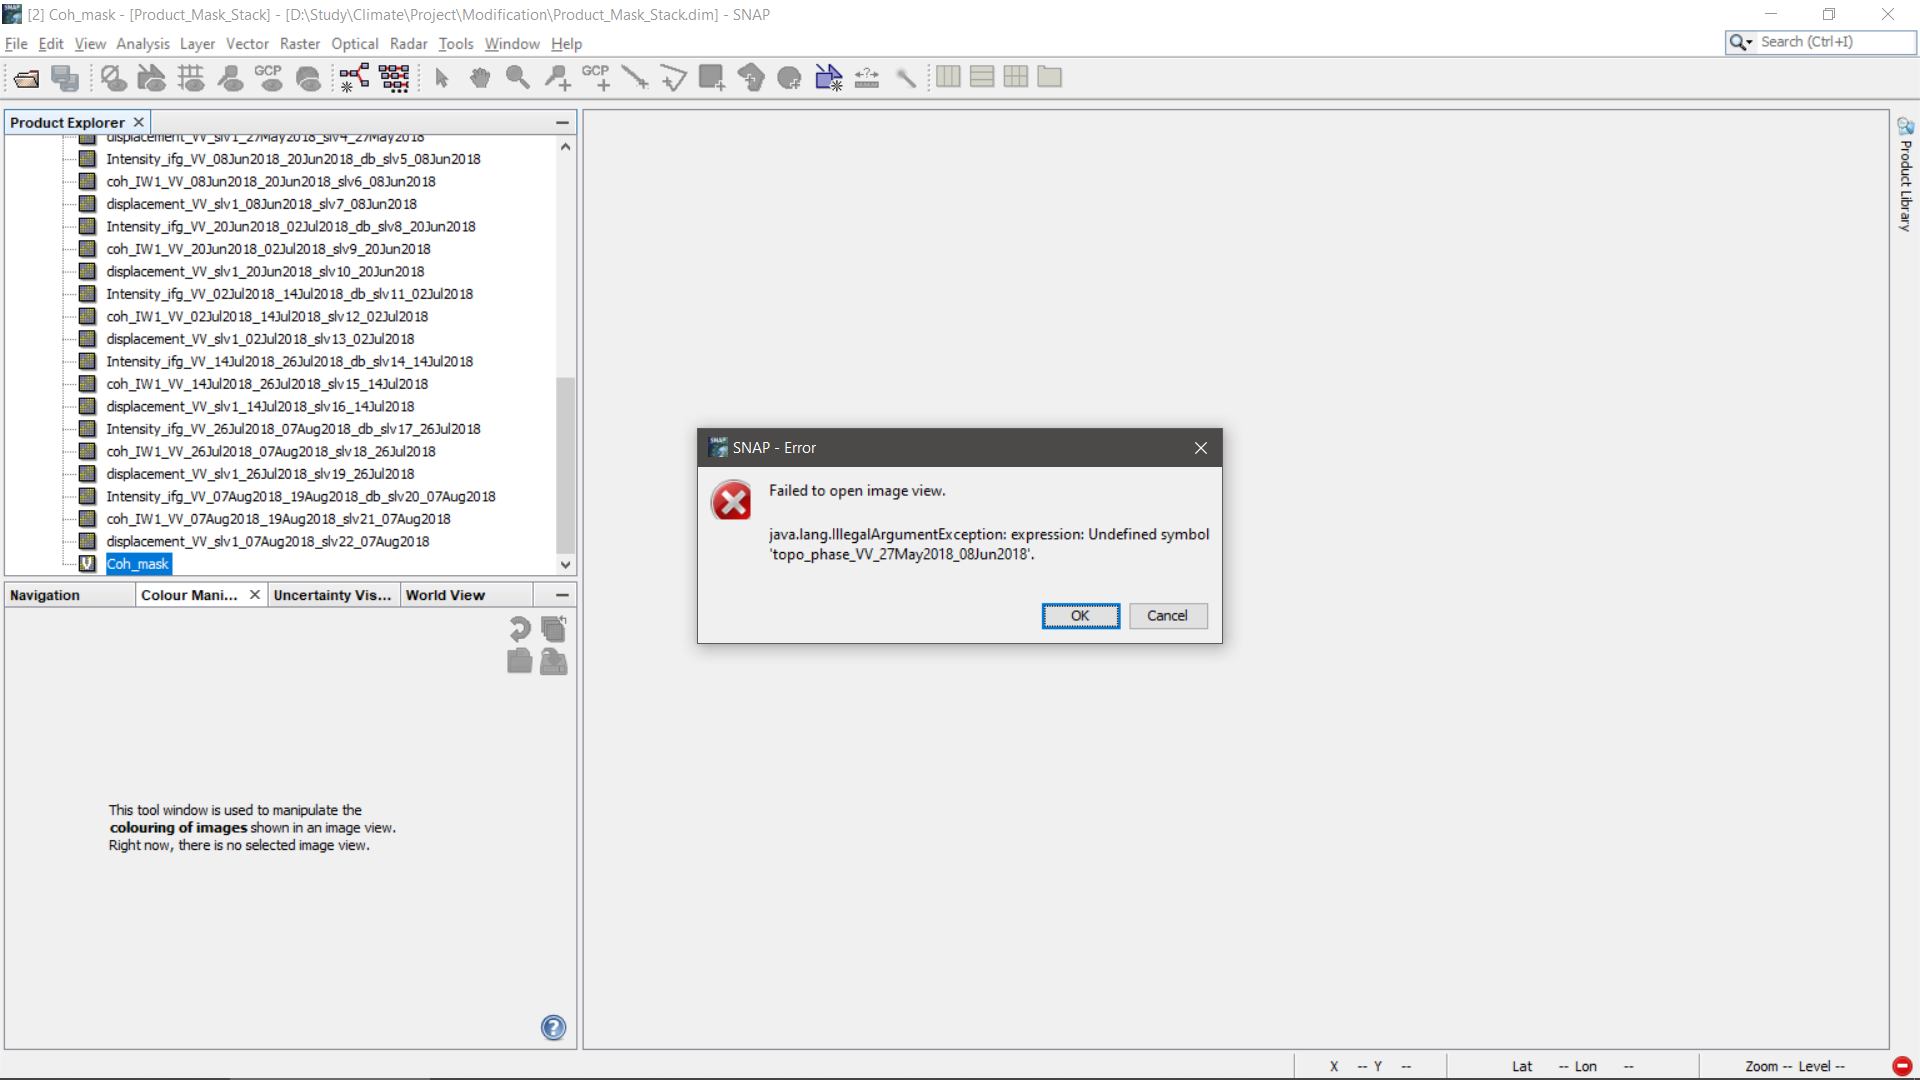
how does the expression look like?
Please check the valid pixel expressions of the coherence bands (in the band properties) if it contains references to the phase bands (should not be the case, but maybe this caused this error).

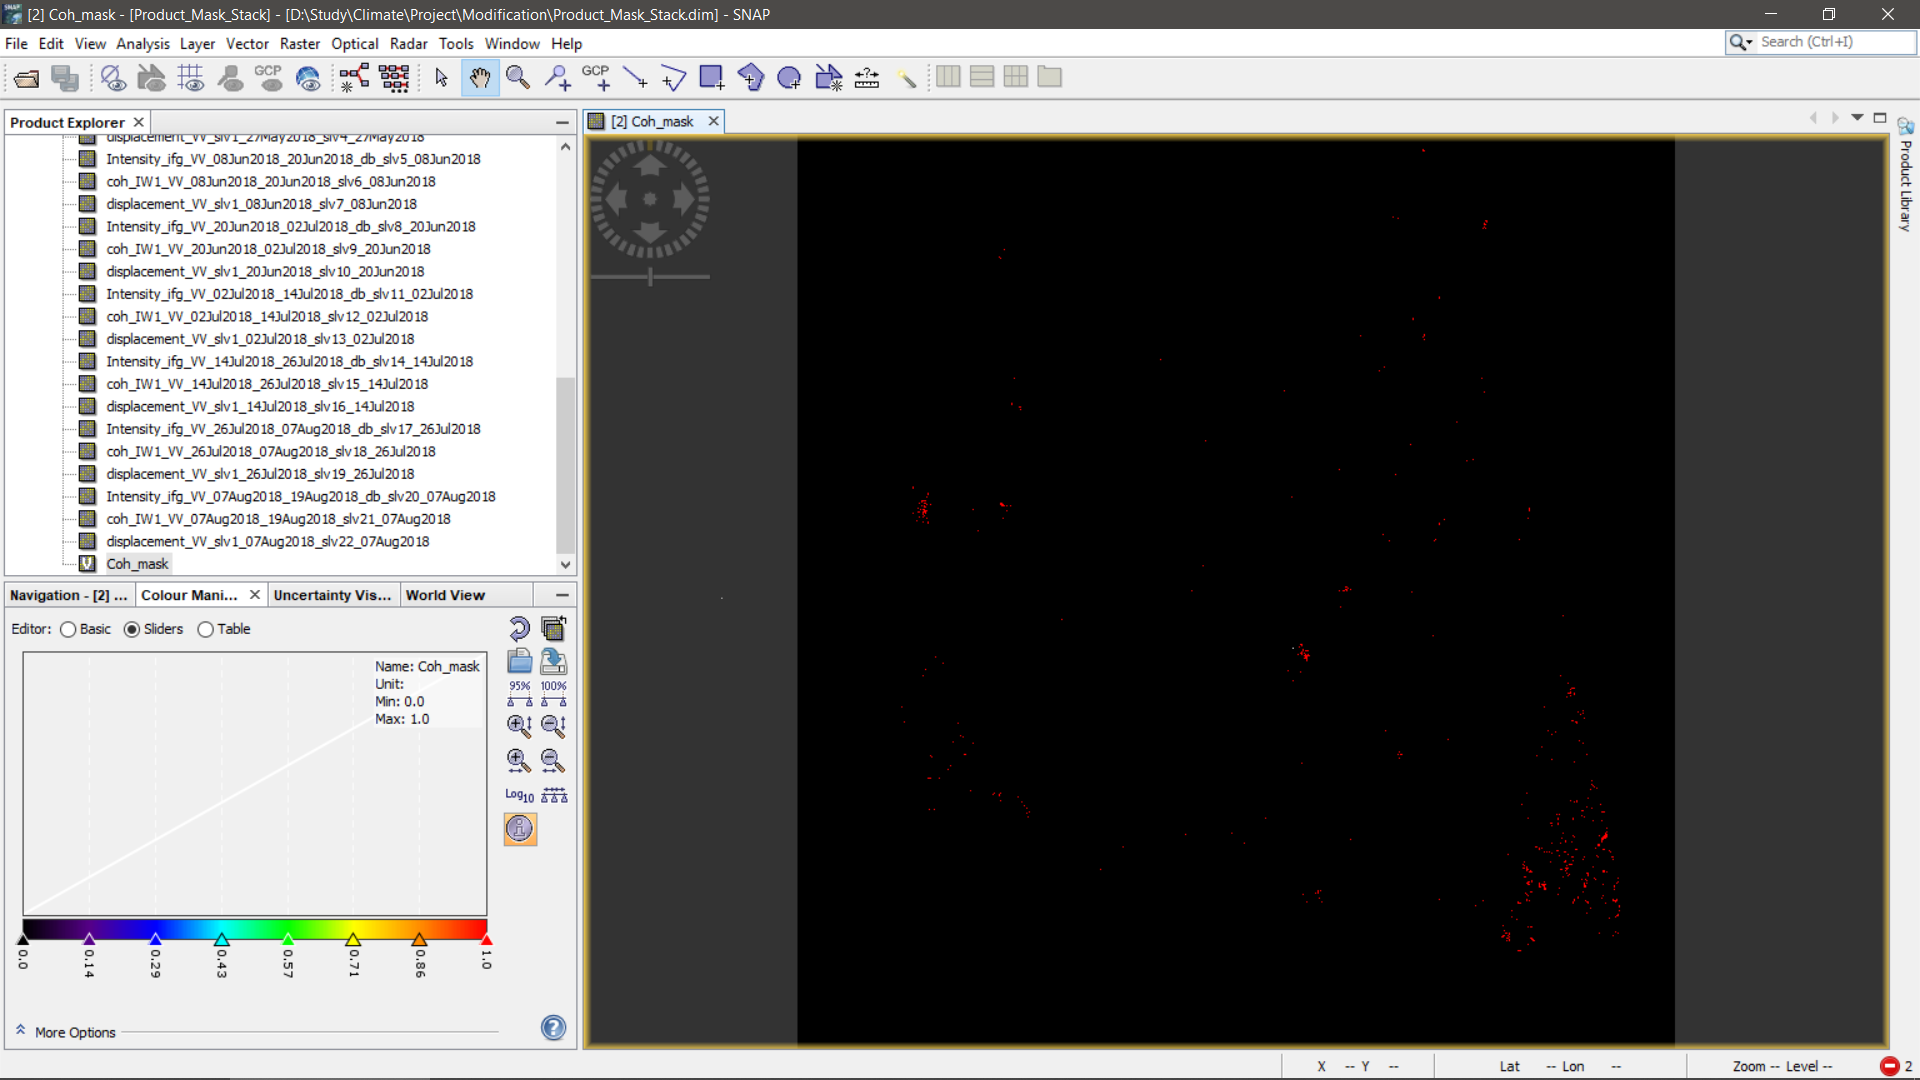
Thanks, The issue was resolved after I edited the valid pixel representations , but I guess I’m getting very less pixel values.
Also how can I get the displacement values from this mask?
yes, the intersection of all thresholds leads to a very little remaining area. Try to reduce the threshold to 0.2 in all images.
Then you can calculate an average displacement in the band maths.
Then use “Coh_mask” as a valid pixel expression to only display the pixels which fulfill the criteria of the mask.
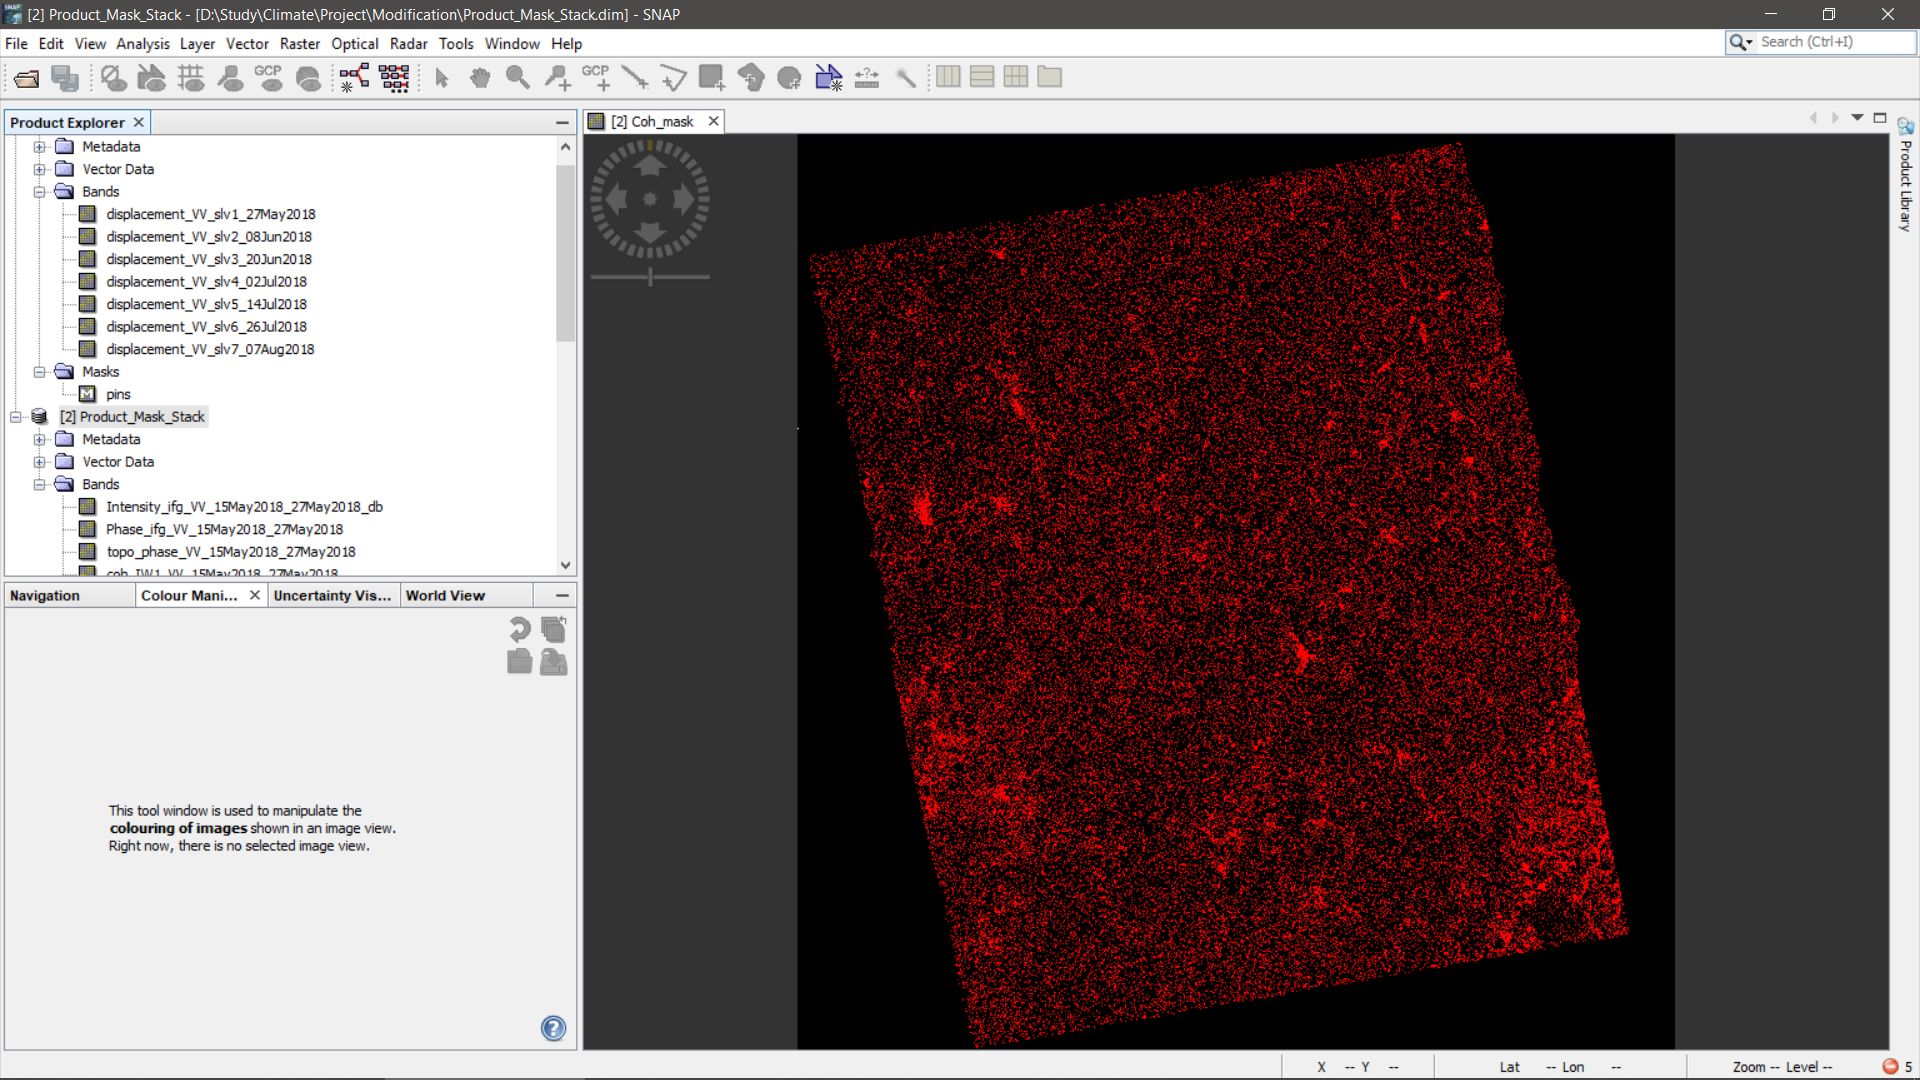
Yes, I’m getting some pixel values after reducing the value to 0.2, but how can I use it to calculate the displacement in band maths?
calculate the average displacement with (disp1+disp2+disp3+disp_n) / n
Then open the band properties of the new band and enter Coh_mask in the valid-pixel expression
Please share the result, I’m curious 
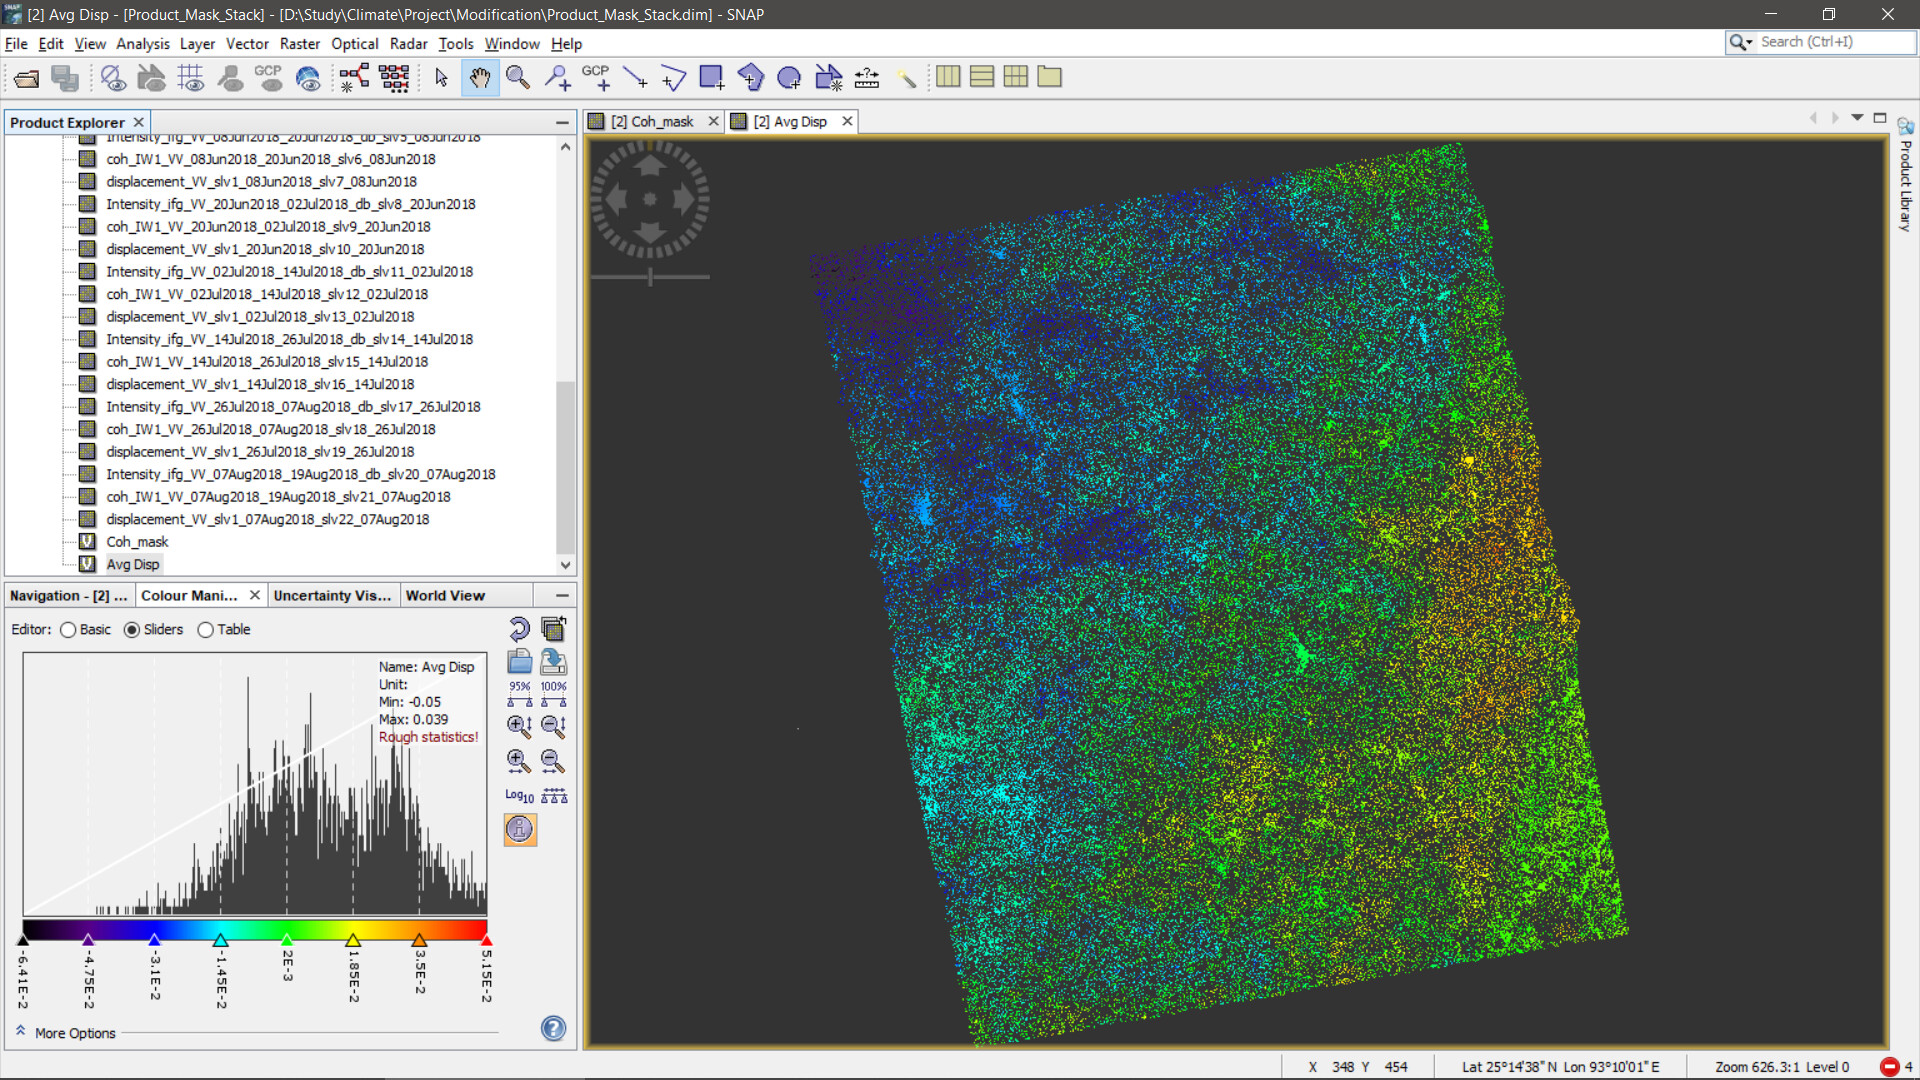
Thanks for the help , I’m sharing the results. The area has undergone both subsidence & uplift. That’s the reason the displacement values are very less I guess.
1 Like
I want to show the development of displacement with soil moisture as well as rainfall. What will be a better way to do it?
especially if you target a long time-series, you might think about getting into persistent scatterer analyses. It requires some understanding of python coding (preparation) and also a matlab license for the application of the scripts (StaMPS), but will give you a temporal graph of deformation per pixel.
A list of good tutorials for a start is given here: StaMPS - Detailled instructions
1 Like
Thank you. I’ll definitely look into it. I do have some backgrounds in Python & I do have a MATLAB license as well.
then this is probably helpful to you as well: PSI using SNAP-STaMPS workflow in Windows Subsystem for Linux (WSL)
The description of variables and their importance, but also the configuration of StaMPS is nice in the GitLab tutorial, but I see them complementary.
1 Like
I’ve seen this, but for now I’m using Windows Subsystem for Linux. So the process needs a tweak I guess.