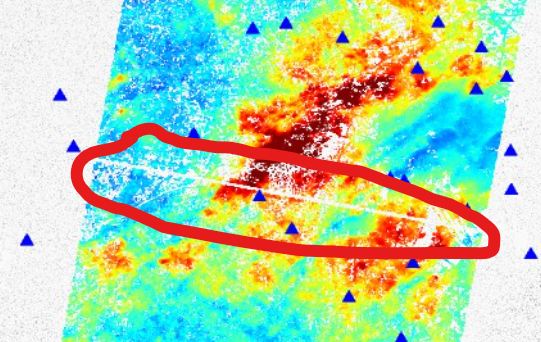
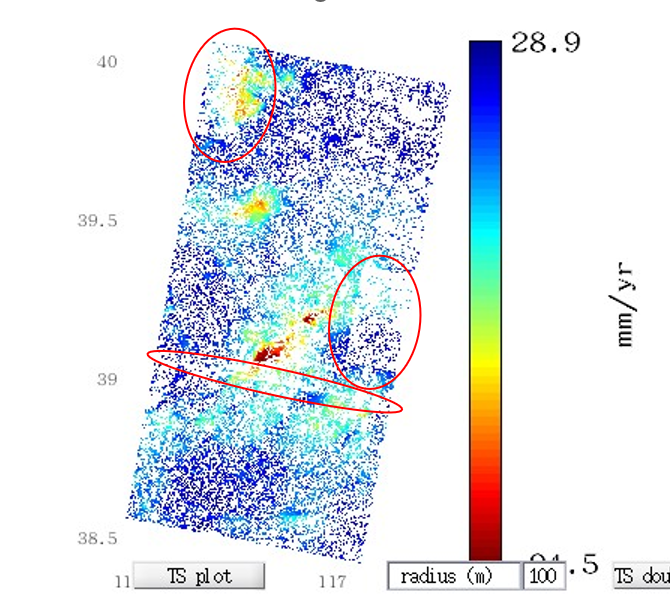
Hello, everyone. I ran stamps(7,7) and ran ps_plot(‘v-dao’,‘a_gacos’,1,0,0,0,‘ts’) to get a deformation rate plot, where clear subsidence funnels can be observed, but patch montage traces can be clearly observed spatially, as shown by the red circles in the figure below.
Running ps_plot(‘w’) to view the interference pairs, clear patch montage traces can also be seen in red circles, as shown below.
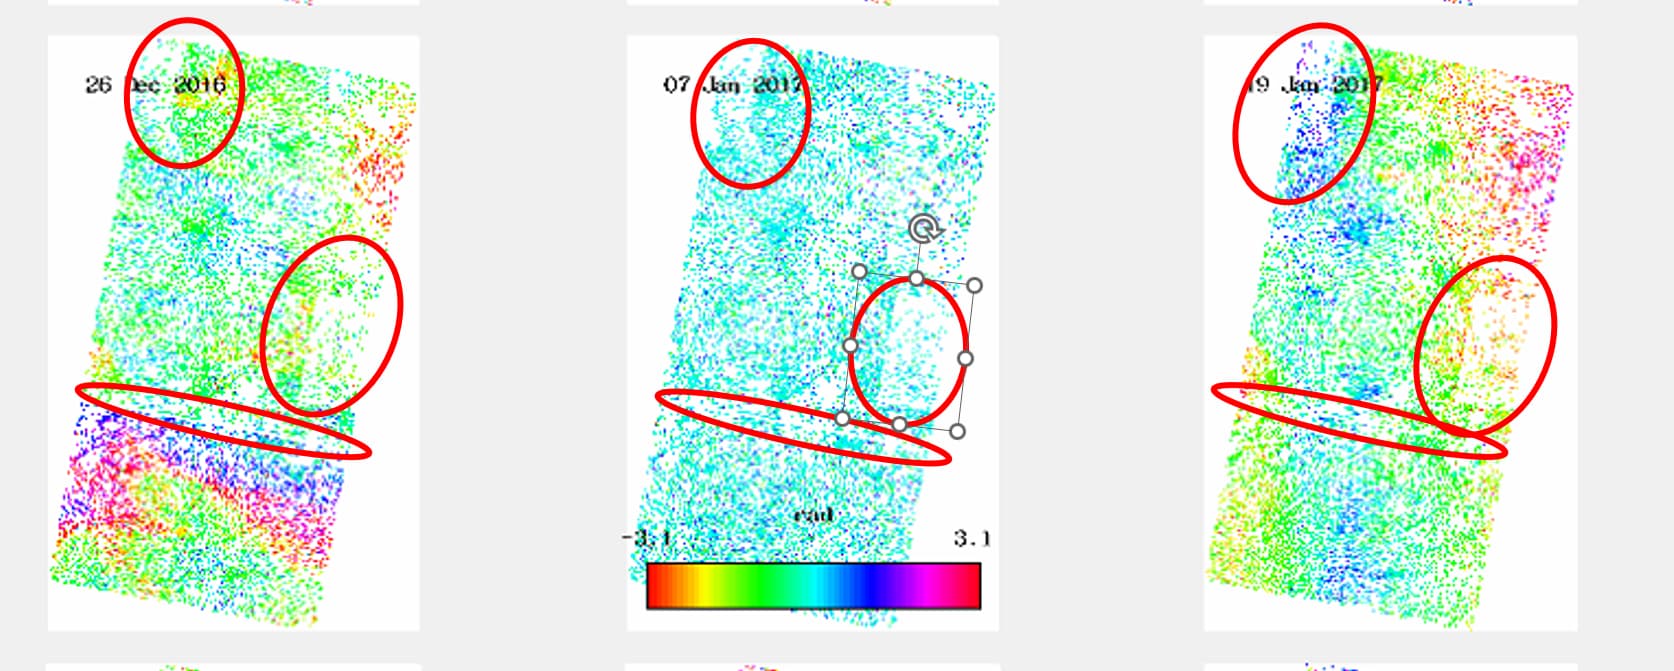
May I ask if this issue was caused by the step 5 of patch merge and how to solve it? Thank you very much for your attention!