Stamps Persistent Scattering v-dao graph interpretation

Hi,

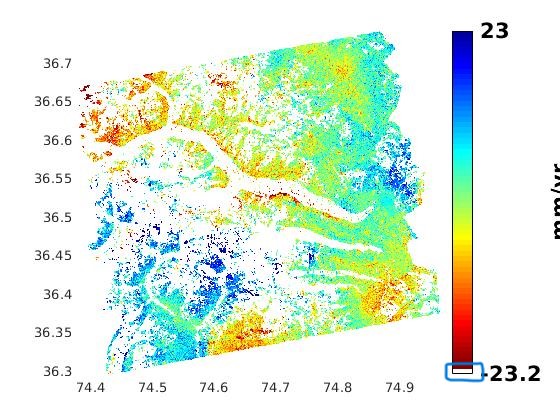
  Iam  doing StaMPS PSI  preprocessing,after velocity estimation this is the graph of v-dao. I am not able to interpret this result. PSI result figure v v-dao .Am confused about the white color it show the highest deformation or red show deformation?

v-dao
time series
time series plot

I think white is empty data. Mainly we consider Red(subsidence) and blue(uplift) colors for velocity plot representation (remaining all colors in between these two colors) as per my knowledge.

2 Likes

Thank you.